
Actor
Steve BuscemiFollow
33 films•1992–2026•Comedy · Adventure · Animation
Avg critics60%
Avg audience64%
Avg domestic$67.3M
Domestic
$2.220B
Lifetime
Worldwide
$5.288B
Lifetime
Avg opening
$17.8M
3-day
Filmography
| Film | Year | Opening | Domestic | Legs | Worldwide | CinemaScore | RT | Yearly rank |
|---|---|---|---|---|---|---|---|---|
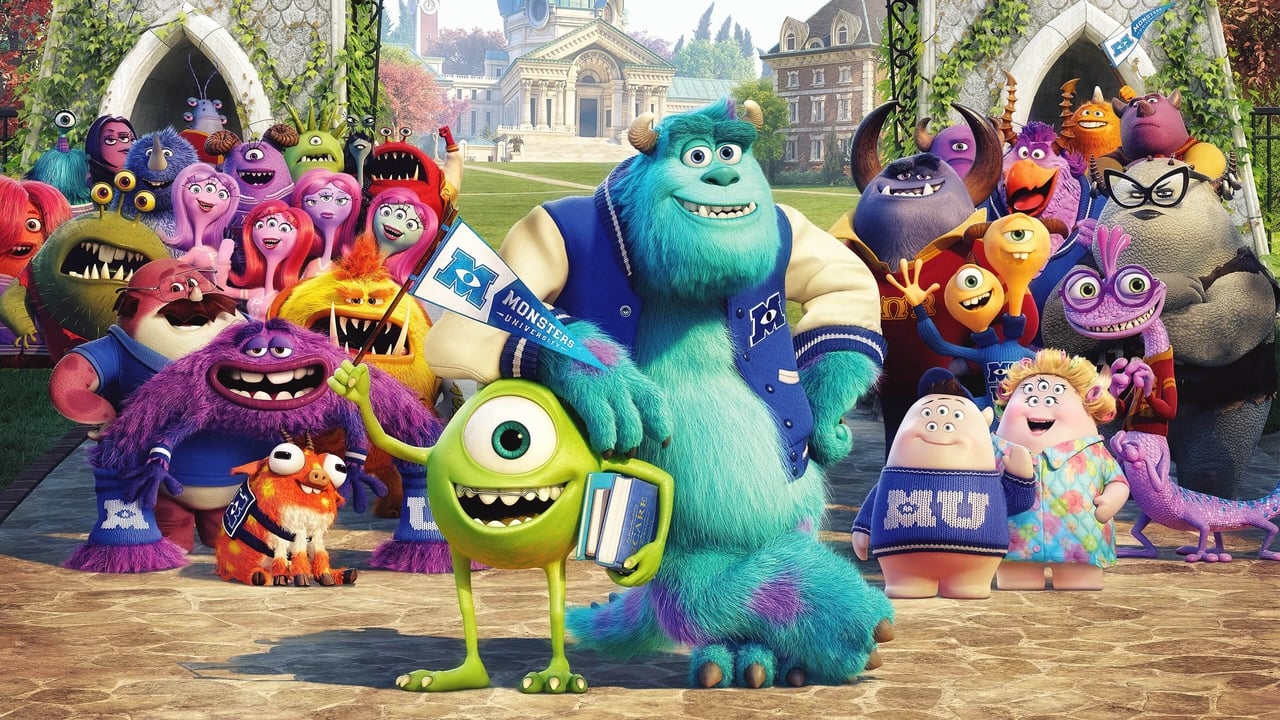
 Monsters University | 2013 | $82.4M | $268.0M | 3.26x | $744.0M | A | 80% | #7 |
 Monsters, Inc. | 2001 | $62.6M | $256.0M | 4.09x | $529.0M | A+ | 96% | #4 |
 Armageddon | 1998 | $36.1M | $199.0M | 5.51x | $554.0M | A- | 42% | — |
 The Boss Baby | 2017 | $50.9M | $175.0M | 3.44x | $504.1M | A | 53% | #17 |
 Hotel Transylvania 2 | 2015 | $48.5M | $169.7M | 3.50x | $474.8M | A- | 55% | #17 |
 Hotel Transylvania 3: Summer Vacation | 2018 | $44.1M | $167.5M | 3.80x | $527.4M | A- | 60% | #20 |
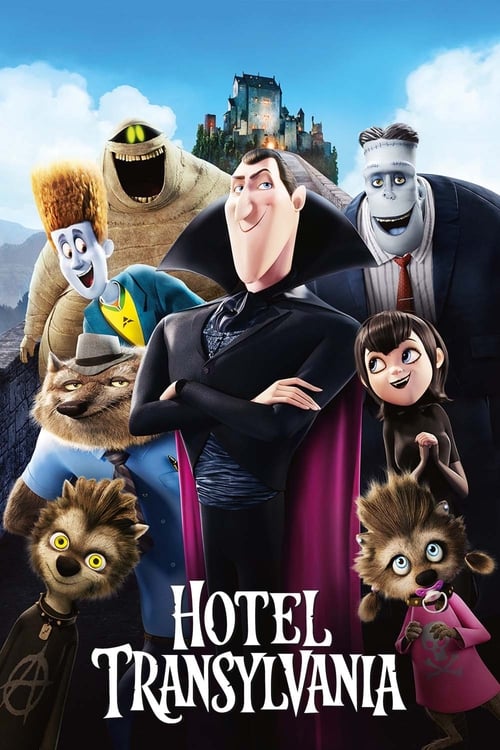 Hotel Transylvania | 2012 | $42.5M | $148.3M | 3.49x | $377.1M | A- | 45% | #19 |
 I Now Pronounce You Chuck & Larry | 2007 | $34.2M | $120.0M | 3.51x | $187.0M | B+ | 15% | #23 |
 Con Air | 1997 | $24.1M | $101.1M | 4.20x | $224.1M | — | 59% | — |
 Spy Kids 2: Island of Lost Dreams | 2002 | $16.7M | $85.8M | 5.14x | $119.7M | A- | 75% | #30 |
 Charlotte's Web | 2006 | $11.5M | $83.0M | 7.24x | $149.0M | A | 79% | #25 |
 Monster House | 2006 | $22.2M | $73.7M | 3.32x | $142.0M | B | 75% | #32 |
 Home on the Range | 2004 | $13.9M | $50.0M | 3.60x | $145.0M | A | 51% | — |
 Domestic Disturbance | 2001 | $14.0M | $45.2M | 3.20x | $54.2M | — | 23% | — |
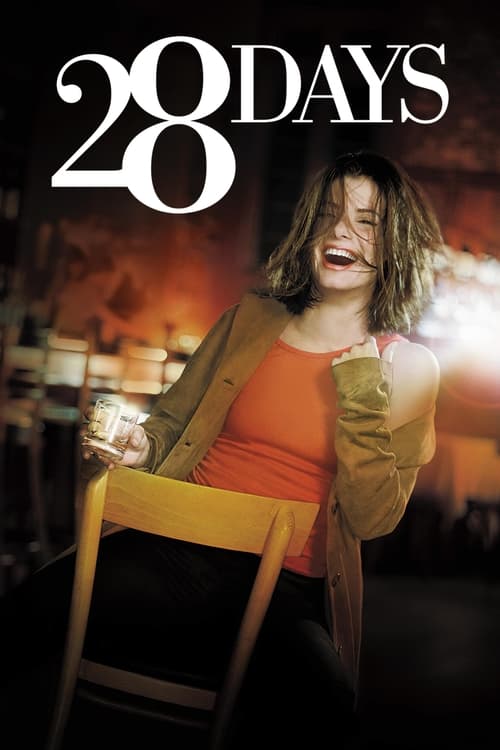 28 Days | 2000 | $10.3M | $37.0M | 3.60x | $62.1M | — | 33% | — |
 The Island | 2005 | $12.4M | $35.8M | 2.89x | $163.0M | B | 39% | — |
 Final Fantasy: The Spirits Within | 2001 | $11.4M | $32.1M | 2.82x | $85.1M | C+ | 44% | — |
 Desperado | 1995 | $7.9M | $25.5M | 3.20x | $25.5M | — | 71% | — |
 Escape from L.A. | 1996 | $8.9M | $25.4M | 2.90x | — | — | 45% | — |
 Fargo | 1996 | $730K | $24.6M | 8.70x | $51.2M | — | 95% | — |
 The Incredible Burt Wonderstone | 2013 | $10.2M | $22.5M | 2.20x | $27.4M | — | 37% | — |
 The Big Lebowski | 1998 | $5.5M | $19.1M | — | $47.8M | — | 79% | — |
 Youth in Revolt | 2010 | $6.9M | $15.3M | 2.20x | $19.7M | — | 66% | — |
 The Death of Stalin | 2018 | $185K | $8.0M | 6.00x | $20.4M | — | 94% | — |
 The Dead Don't Die | 2019 | $2.5M | $6.8M | 2.70x | $15.7M | — | 55% | — |
 Ghost World | 2001 | $99K | $6.2M | 13.5x | $8.8M | — | 93% | — |
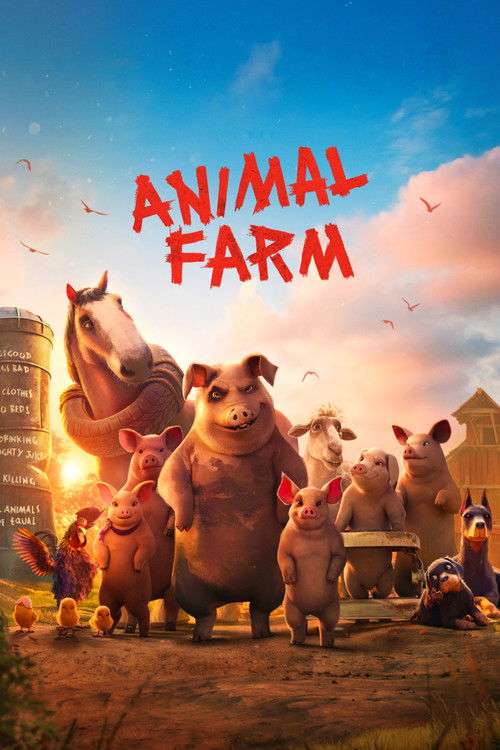 Animal Farm | 2026 | $3.3M | $5.5M | 1.70x | $5.5M | C- | 24% | #93 |
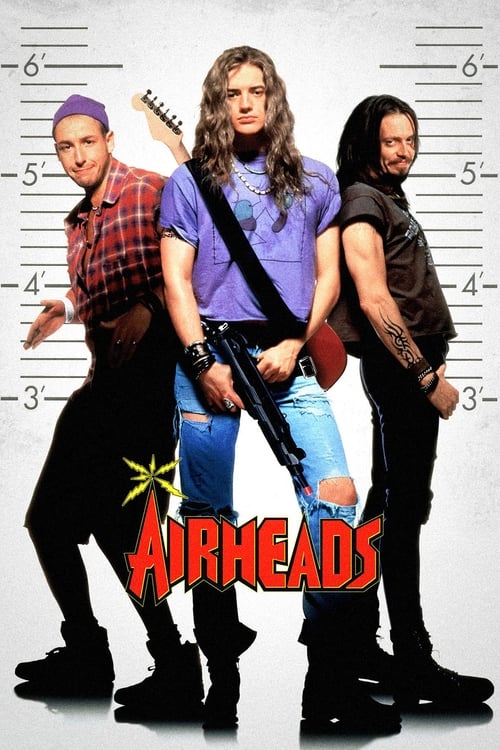 Airheads | 1994 | $1.9M | $5.0M | 2.60x | — | — | 32% | — |
 Paris, Je T'aime | 2006 | $39K | $4.9M | 10.0x | — | — | 85% | — |
 Reservoir Dogs | 1992 | $148K | $2.8M | 19.2x | $3.0M | — | 90% | — |
 Mary Oliver: Saved by the Beauty of the World | 2026 | $25K | $788K | 31.5x | $0.6M | — | 0% | #139 |
 Hotel Transylvania 4: Transformania | 2022 | — | — | — | $18.5M | — | 47% | — |
 The King of Staten Island | 2020 | — | — | — | $1.8M | — | 76% | — |
Click any column to sort. Yearly rank is the film’s place on its release year’s domestic chart; a film outside that year’s top 50 shows a dash.
Film by film
0$250M$500M$750M
DomesticInternationalColumn height is worldwide · one film every 1.1 years
Profitability
Return on budget
3.0x
$5.227B worldwide on $1.763B of production budget
Theatrical breakeven point is approx. 2.5x production budget
Domestic vs international split
Domestic $2.163BInternational $3.064B
Return by film
Worldwide ÷ budget0x2.5x breakeven8.1x
Budgets are reported production costs and exclude marketing, so this is a gross-to-budget ratio rather than studio profit. Films with no reported budget, and streaming releases with no real theatrical run, are left out of this section entirely, including from the totals, rather than counted as zero.
Records held
All records#5All-time G domesticMonsters University$268.5M#6All-time G domesticMonsters, Inc.$255.9M#9Biggest September openingsHotel Transylvania 2$48.5M#9Best second-weekend holds ($50M+ openers)Monsters, Inc.−27.2%#10Biggest September openingsHotel Transylvania$42.5M#18Biggest June openingsMonsters University$82.4M#20Biggest animated openingsMonsters University$82.4M
7 placings across 5 all-time charts. Where a film places on the same chart in consecutive weekends, only its best placing is shown.
What’s next
Full scheduleConnected
Series
Counted from this filmography. The number is how many of these films each one accounts for.