



Studio
Orion Pictures
27 films•1982–1994•Drama · Comedy · Crime
80%average critics75%average audience$49.5Mdomestic average
Films
27
1982–1994
Domestic
$1.34B
lifetime
Worldwide
$996.7M
lifetime
Avg opening
$3.5M
3-day
Avg legs
8.87x
opening → total
Return
12.8x
on $74.4M of budget
Filmography
| Film | Year | Opening | Domestic | Legs | Worldwide | CinemaScore | RT | Yearly rank |
|---|---|---|---|---|---|---|---|---|
| Dances With Wolves | 1990 | $598K | $184.0M | 19.4x | $424.0M | — | 87% | — |
| Platoon | 1986 | $241K | $138.0M | 16.5x | — | — | 89% | — |
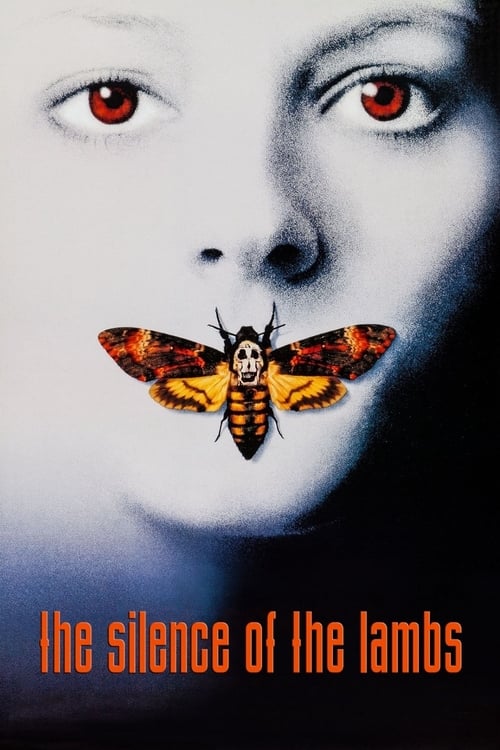
| The Silence of the Lambs | 1991 | — | $131.1M | — | $273.1M | — | 95% | — |
| Back to School | 1986 | $8.9M | $91.3M | 10.3x | — | — | 81% | — |
 RoboCop | 1987 | $8.0M | $53.4M | 6.70x | $54.1M | — | 84% | — |
 Throw Momma from the Train | 1987 | $7.3M | $53.4M | 7.30x | — | — | 65% | — |
 Amadeus | 1984 | $505K | $52.0M | — | — | — | 90% | — |
 Bull Durham | 1988 | $5.0M | $50.9M | 10.2x | — | — | 97% | — |
 First Blood | 1982 | $6.6M | $47.2M | 7.10x | $125.2M | — | 86% | — |
 Colors | 1988 | $4.7M | $46.6M | 7.10x | — | B- | 76% | — |
 Dirty Rotten Scoundrels | 1988 | $3.8M | $42.0M | 10.9x | — | B+ | 89% | — |
 Bill & Ted's Excellent Adventure | 1989 | $6.2M | $40.5M | 6.60x | — | — | 83% | — |
 Hannah and Her Sisters | 1986 | $1.3M | $40.1M | 12.3x | — | — | 92% | — |
 Three Amigos! | 1986 | $5.9M | $39.2M | 6.60x | — | B | 44% | — |
 The Terminator | 1984 | $4.0M | $38.0M | 9.50x | $78.0M | — | 90% | — |
 Bill & Ted's Bogus Journey | 1991 | $10.2M | $37.5M | 3.70x | — | — | 57% | — |
 No Way Out | 1987 | $4.3M | $35.5M | 8.30x | — | B+ | 92% | — |
 Mermaids | 1990 | $3.5M | $35.1M | 10.0x | $38.9M | — | 71% | — |
 Mississippi Burning | 1988 | $225K | $34.6M | 8.60x | — | A | 79% | — |
 Hoosiers | 1986 | $220K | $28.6M | 10.0x | — | — | 90% | — |
 Desperately Seeking Susan | 1985 | $1.5M | $27.4M | 10.2x | — | — | 86% | — |
 The Cotton Club | 1984 | $2.9M | $25.9M | 8.90x | — | — | 76% | — |
 F/X | 1986 | $3.2M | $20.6M | 6.40x | — | — | 89% | — |
 Crimes and Misdemeanors | 1989 | $911K | $18.3M | 6.90x | — | — | 92% | — |
 RoboCop 3 | 1993 | $4.3M | $10.7M | 2.50x | — | — | 18% | — |
 The Purple Rose of Cairo | 1985 | $114K | $10.6M | 11.4x | — | — | 93% | — |
 Blue Sky | 1994 | $764K | $3.4M | 4.40x | $3.4M | — | 80% | — |
Click any column to sort. Yearly rank is the film’s place on its release year’s domestic chart; a film outside that year’s top 50 shows a dash.
Film by film
0$250M
First Blood1982Amadeus1984The Terminator1984Platoon1986Back to School1986Hannah and Her Sisters1986Three Amigos!1986Hoosiers1986RoboCop1987Throw Momma from the Train1987No Way Out1987Bull Durham1988Colors1988Dirty Rotten Scoundrels1988Mississippi Burning1988Bill & Ted's Excellent Adventure1989Dances With Wolves1990Mermaids1990The Silence of the Lambs1991Bill & Ted's Bogus Journey1991DomesticInternationalColumn height is worldwide
Profitability
Return on Budget
12.8x
$954.4M worldwide on $74.4M of production budget
Theatrical breakeven point is approx. 2.5x production budget
Domestic vs International Split
Domestic $453.7MInternational $500.7M
Return by film · worldwide ÷ budget
0x2.5x breakeven19.3x
Budgets are reported production costs and exclude marketing, so this is a gross-to-budget ratio rather than studio profit. Films with no reported budget, and streaming releases with no real theatrical run, are left out of this section entirely, including from the totals, rather than counted as zero.
Records held
All records →#8Biggest 10th weekendsPlatoon$8.2M#8Most weekends in the top 10Dances With Wolves25 weekends#12Most weekends in the top 10Platoon22 weekends#16Biggest grossers never #1Dances With Wolves$184.2M#19Biggest 9th weekendsDances With Wolves$7.3M
5 placings across 4 all-time charts. Where a film places on the same chart in consecutive weekends, only its best placing is shown.
What’s next
Full schedule →No upcoming movies announced yet.
Connected
Directors
Series
Counted from this filmography. The number is how many of these films each one accounts for.