
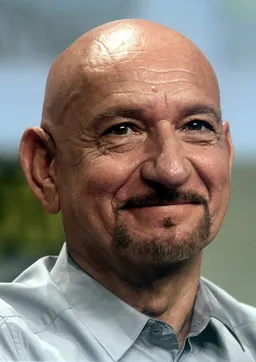
Actor
Ben KingsleyFollow
28 films•1982–2026•Drama · Adventure · Action
Avg critics65%
Avg audience70%
Avg domestic$63.2M
Domestic
$1.707B
Lifetime
Worldwide
$3.924B
Lifetime
Avg opening
$16.4M
3-day
Filmography
| Film | Year | Opening | Domestic | Legs | Worldwide | CinemaScore | RT | Yearly rank |
|---|---|---|---|---|---|---|---|---|
 The Jungle Book | 2016 | $103.3M | $364.0M | 3.53x | $950.7M | A | 95% | #5 |
 Shang-Chi and the Legend of the Ten Rings | 2021 | $71.4M | $224.5M | 3.10x | $432.2M | A | 92% | #2 |
 Shutter Island | 2010 | $41.1M | $128.0M | 3.12x | $295.0M | C+ | 69% | #20 |
 Schindler's List | 1993 | $657K | $96.9M | 20.9x | $322.0M | — | 98% | — |
 Prince of Persia: The Sands of Time | 2010 | $30.1M | $90.8M | 3.02x | $336.0M | B | 37% | #37 |
 Hugo | 2011 | $11.4M | $73.9M | 6.50x | $186.0M | B+ | 93% | #48 |
 Exodus: Gods and Kings | 2014 | $24.1M | $65.0M | 2.70x | $268.3M | — | 29% | — |
 Dave | 1993 | $7.3M | $63.3M | 8.70x | — | A- | 95% | — |
 Ender's Game | 2013 | $27.0M | $61.7M | 2.30x | $128.0M | — | 63% | — |
 Rules of Engagement | 2000 | $15.0M | $61.3M | 4.09x | $71.7M | A- | 36% | #38 |
 Species | 1995 | $17.2M | $60.1M | 3.50x | $113.4M | B- | 42% | — |
 The Dictator | 2012 | $17.4M | $59.7M | 3.42x | $179.0M | C | 56% | — |
 Gandhi | 1982 | $2.3M | $52.8M | 15.5x | $127.8M | — | 89% | — |
 Sneakers | 1992 | $10.0M | $51.4M | 5.10x | $105.2M | A- | 80% | — |
 The Boxtrolls | 2014 | $17.3M | $50.8M | 2.90x | $111.9M | — | 78% | — |
 Bugsy | 1991 | $140K | $49.1M | 10.6x | $49.1M | — | 84% | — |
 Young Washington | 2026 | $19.4M | $47.1M | 2.40x | $47.2M | A | 59% | #35 |
 Lucky Number Slevin | 2006 | $7.0M | $22.5M | 3.20x | $55.5M | — | 52% | — |
 Tuck Everlasting | 2002 | $5.3M | $19.2M | 3.60x | $19.3M | — | 61% | — |
 Operation Finale | 2018 | $6.0M | $17.6M | 2.90x | — | — | 60% | — |
 House of Sand and Fog | 2003 | $46K | $13.0M | 7.30x | $16.2M | — | 74% | — |
 Self/less | 2015 | $5.4M | $12.3M | 2.30x | $33.7M | — | 18% | — |
 The Walk | 2015 | $1.6M | $10.2M | 2.70x | $61.5M | — | 83% | — |
 Sexy Beast | 2001 | $170K | $6.9M | 40.8x | $10.2M | — | 87% | — |
| 2026 | $2.1M | $4.3M | 2.00x | $4.3M | B | 72% | #101 | |
 Desert Warrior | 2026 | $488K | $666K | 1.40x | — | — | 25% | #143 |
 The Thursday Murder Club | 2025 | — | — | — | — | — | 77% | — |
 Night Hunter | 2018 | — | — | — | — | — | 14% | — |
Click any column to sort. Yearly rank is the film’s place on its release year’s domestic chart; a film outside that year’s top 50 shows a dash.
Film by film
0$250M$500M$750M
DomesticInternationalColumn height is worldwide · one film every 1.6 years
Profitability
Return on budget
2.6x
$3.766B worldwide on $1.423B of production budget
Theatrical breakeven point is approx. 2.5x production budget
Domestic vs international split
Domestic $1.521BInternational $2.245B
Return by film
Worldwide ÷ budget0x2.5x breakeven11.6x
Budgets are reported production costs and exclude marketing, so this is a gross-to-budget ratio rather than studio profit. Films with no reported budget, and streaming releases with no real theatrical run, are left out of this section entirely, including from the totals, rather than counted as zero.
Records held
All records#1Biggest Labor Day openingsShang-Chi and the Legend of the Ten Rings$94.7M#5Biggest September openingsShang-Chi and the Legend of the Ten Rings$75.4M#7Biggest April openingsThe Jungle Book$103.3M#10Best second-weekend holds ($100M+ openers)The Jungle Book−40.4%#14Biggest video game moviesPrince of Persia: The Sands of Time$90.8M#20Biggest February openingsShutter Island$41.1M
6 placings across 6 all-time charts. Where a film places on the same chart in consecutive weekends, only its best placing is shown.
What’s next
Full scheduleNo upcoming movies announced yet.
Connected
Counted from this filmography. The number is how many of these films each one accounts for.