


Studio
Metro-Goldwyn-MayerFollow
132 films•1932–2024•Drama · Comedy · Action
Avg critics68%
Avg audience73%
Avg domestic$38.7M
Domestic
$5.104B
Lifetime
Worldwide
$8.195B
Lifetime
Avg opening
$7.7M
3-day
Filmography
| Film | Year | Opening | Domestic | Legs | Worldwide | CinemaScore | RT | Yearly rank |
|---|---|---|---|---|---|---|---|---|
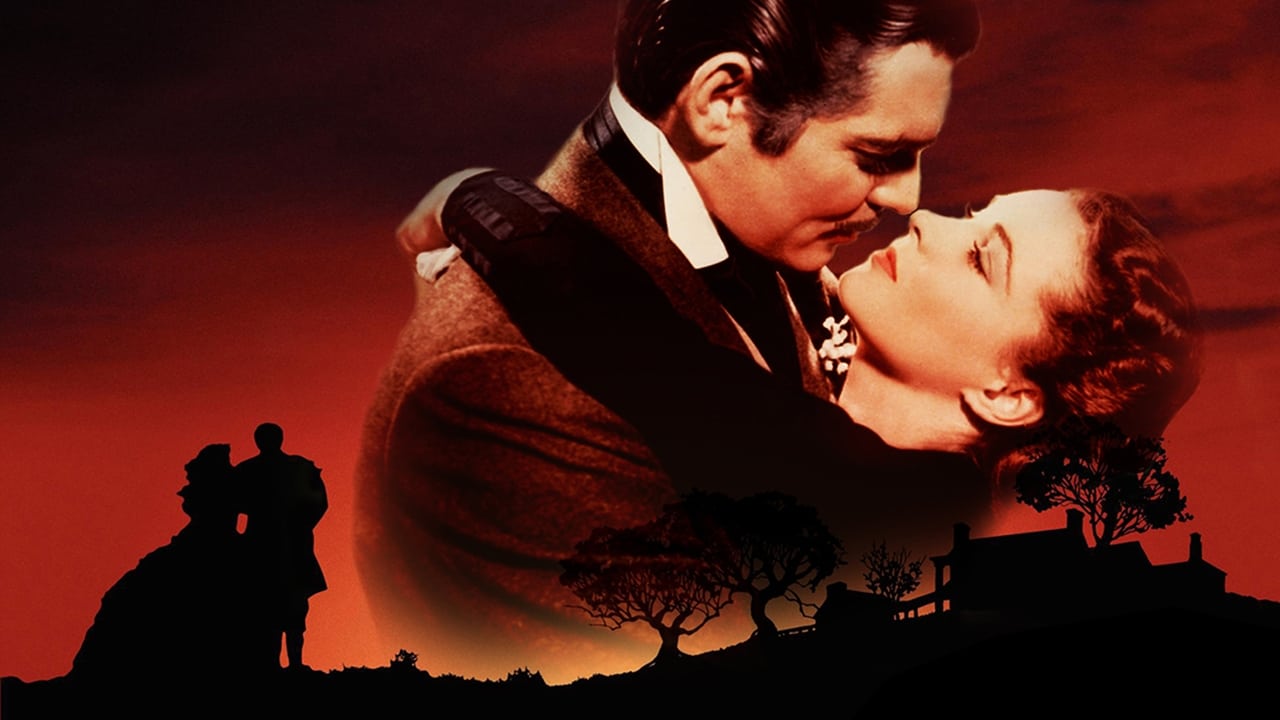
| Gone with the Wind | 1939 | — | $198.7M | — | $390.5M | — | 90% | — |
| Hannibal | 2001 | $58.0M | $165.0M | 2.80x | $352.0M | C+ | 39% | #12 |
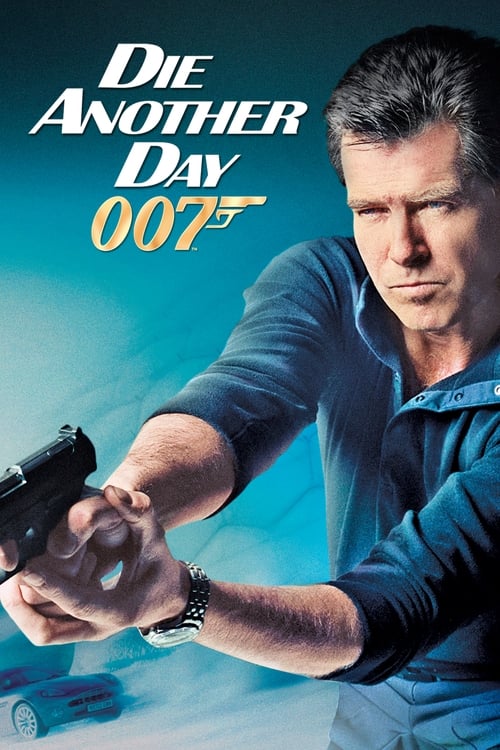
| Die Another Day | 2002 | $47.1M | $160.9M | 3.42x | $431.9M | A- | 55% | #11 |
| Rocky IV | 1985 | $20.0M | $127.9M | — | $300.4M | — | 38% | — |
 The World Is Not Enough | 1999 | $35.5M | $126.9M | 3.60x | $361.7M | — | 51% | — |
 Tomorrow Never Dies | 1997 | $25.1M | $125.3M | 5.00x | $339.5M | — | 58% | — |
 Rocky III | 1982 | $12.4M | $125.0M | 10.1x | $270.0M | — | 66% | — |
 Creed II | 2018 | $35.6M | $115.7M | 3.30x | $214.2M | A | 83% | #30 |
 Doctor Zhivago | 1965 | — | $111.9M | — | $112.1M | — | 82% | — |
 GoldenEye | 1995 | $26.2M | $106.4M | 3.84x | $356.4M | A- | 80% | — |
 Legally Blonde | 2001 | $20.4M | $96.5M | 4.74x | $142.0M | A- | 72% | #22 |
 Legally Blonde 2: Red, White & Blonde | 2003 | $22.2M | $90.2M | 4.06x | $125.0M | B | 35% | #33 |
 Moonstruck | 1987 | — | $80.6M | — | $83.1M | — | 90% | — |
 Barbershop | 2002 | $20.6M | $75.8M | 3.70x | $77.1M | A- | 82% | #35 |
 Poltergeist | 1982 | $6.9M | $74.8M | 10.8x | $121.8M | — | 89% | — |
 WarGames | 1983 | $6.2M | $74.4M | 12.0x | — | — | 93% | — |
 Ben-Hur | 1959 | — | $73.0M | — | $73.2M | — | 88% | — |
 1408 | 2007 | $20.6M | $72.0M | 3.49x | $133.0M | B- | 80% | #37 |
 Get Shorty | 1995 | $12.7M | $72.0M | 5.70x | $115.0M | — | 89% | — |
 Stargate | 1994 | $16.7M | $71.6M | 4.30x | $196.6M | — | 53% | — |
 Rocky Balboa | 2006 | $12.2M | $70.3M | 5.78x | $156.2M | B+ | 78% | #38 |
 The Thomas Crown Affair | 1999 | $14.6M | $69.3M | 4.70x | $124.3M | B+ | 68% | — |
 Octopussy | 1983 | $8.9M | $67.9M | 7.60x | $187.5M | — | 41% | — |
 The Beekeeper | 2024 | $16.6M | $66.2M | 4.00x | $162.6M | B+ | 70% | #34 |
 The Amityville Horror | 2005 | $23.5M | $65.2M | 2.78x | $108.0M | B | 23% | #39 |
 Barbershop 2: Back in Business | 2004 | $24.2M | $65.1M | 2.69x | $65.8M | A- | 69% | #45 |
 A Fish Called Wanda | 1988 | $115K | $63.5M | 13.2x | — | A | 96% | — |
 Species | 1995 | $17.2M | $60.1M | 3.50x | $113.4M | B- | 42% | — |
 Halloween | 2007 | $26.4M | $58.3M | 2.21x | $77.5M | B- | 28% | #43 |
 2001: A Space Odyssey | 1968 | — | $58.1M | — | $69.9M | — | 90% | — |
 Willow | 1988 | $8.3M | $57.3M | 6.90x | — | A- | 53% | — |
 The Man in the Iron Mask | 1998 | $17.3M | $57.0M | 3.30x | $183.0M | — | 32% | — |
 Be Cool | 2005 | $23.5M | $56.0M | 2.39x | $94.9M | B- | 29% | #49 |
 House of Gucci | 2021 | $14.4M | $53.8M | 3.74x | $153.3M | B+ | 61% | #25 |
 The Living Daylights | 1987 | $11.1M | $51.2M | 4.60x | $191.2M | — | 75% | — |
 Hot Tub Time Machine | 2010 | $14.0M | $50.3M | 3.60x | $66.0M | — | 64% | — |
 A View to a Kill | 1985 | $13.3M | $50.3M | 3.80x | $152.6M | — | 36% | — |
 Stigmata | 1999 | $18.3M | $50.0M | 2.70x | $89.4M | — | 0% | — |
 Agent Cody Banks | 2003 | $14.1M | $47.5M | 3.40x | $58.2M | — | 38% | — |
 Walking Tall | 2004 | $15.5M | $46.2M | 3.00x | $47.9M | B+ | 27% | — |
 Thelma & Louise | 1991 | — | $45.4M | — | $45.6M | — | 87% | — |
 The Dirty Dozen | 1967 | — | $45.3M | — | — | — | 82% | — |
 The Return of the Pink Panther | 1975 | — | $41.8M | — | — | — | 79% | — |
 Ronin | 1998 | $12.7M | $41.6M | 3.30x | $70.7M | — | 70% | — |
 Bandits | 2001 | $13.1M | $41.5M | 3.20x | $71.5M | — | 64% | — |
 Out of Time | 2003 | $16.2M | $41.1M | 2.50x | $55.5M | — | 65% | — |
 Poltergeist II: The Other Side | 1986 | $12.4M | $41.0M | 3.30x | — | — | 20% | — |
 2010: The Year We Make Contact | 1984 | $7.4M | $41.0M | 5.50x | — | — | 68% | — |
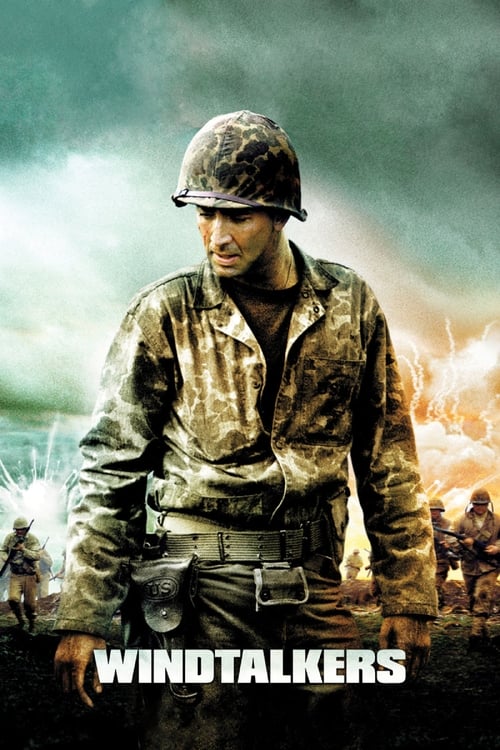 Windtalkers | 2002 | $14.5M | $40.9M | 2.80x | $77.6M | — | 33% | — |
 Heartbreakers | 2001 | $11.8M | $40.3M | 3.40x | $57.8M | — | 55% | — |
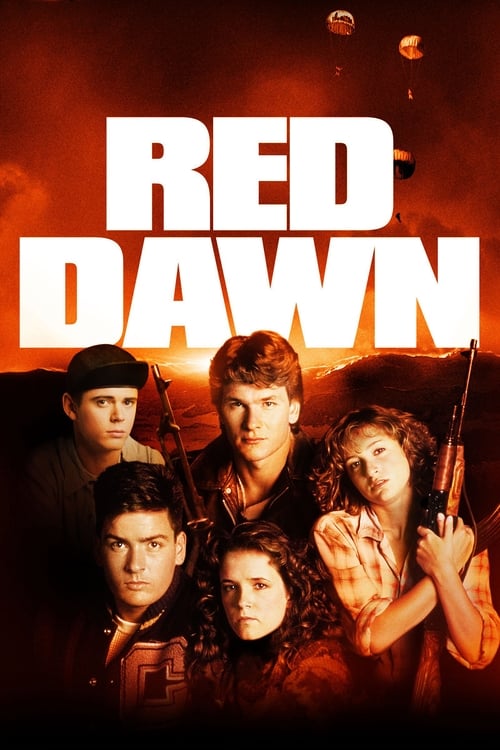 Red Dawn | 1984 | $8.2M | $38.9M | 4.70x | — | — | 48% | — |
 Spaceballs | 1987 | $6.6M | $38.1M | 5.80x | $38.1M | — | 53% | — |
 Jeepers Creepers | 2001 | $13.1M | $37.9M | 2.90x | $58.9M | — | 47% | — |
 Autumn in New York | 2000 | $11.0M | $37.8M | 3.44x | $90.7M | C+ | 20% | — |
 Uptown Girls | 2003 | $11.3M | $37.1M | 3.30x | $37.1M | — | 14% | — |
 Last Tango in Paris | 1972 | — | $36.1M | — | — | — | 81% | — |
 The Wizard of Oz | 1939 | — | $35.6M | — | — | — | 98% | — |
 Licence to Kill | 1989 | $8.8M | $34.7M | 4.00x | $156.2M | — | 79% | — |
 Death Wish | 2018 | $13.0M | $34.0M | 2.60x | $48.6M | — | 18% | — |
 Return to Me | 2000 | $7.8M | $32.7M | 4.20x | $36.5M | — | 62% | — |
 Leaving Las Vegas | 1995 | $71K | $32.0M | 9.80x | $49.8M | — | 91% | — |
 Rob Roy | 1995 | $2.0M | $31.4M | 4.40x | — | — | 73% | — |
 Blown Away | 1994 | $10.4M | $30.1M | 2.90x | — | — | 39% | — |
 Clash of the Titans | 1981 | $6.6M | $30.0M | 4.60x | $44.4M | — | 65% | — |
 Mr. Brooks | 2007 | $10.0M | $28.5M | 2.80x | $46.0M | — | 56% | — |
 Wrath of Man | 2021 | $8.1M | $27.5M | 3.40x | $104.0M | A- | 68% | #40 |
 Overboard | 1987 | $1.9M | $26.7M | 14.2x | — | A- | 46% | — |
 Superhero Movie | 2008 | $9.5M | $26.6M | 2.80x | $73.0M | — | 17% | — |
 All Dogs Go to Heaven | 1989 | $4.7M | $26.2M | 5.60x | — | — | 46% | — |
 The Nanny Diaries | 2007 | $7.5M | $25.9M | 3.50x | $46.0M | — | 34% | — |
 The Mist | 2007 | $8.9M | $25.6M | 2.90x | $57.2M | — | 74% | — |
 Kingpin | 1996 | $5.6M | $25.0M | 4.50x | $32.2M | — | 53% | — |
 Logan's Run | 1976 | — | $25.0M | — | — | — | 58% | — |
 In the Heat of the Night | 1967 | — | $24.4M | — | — | — | 96% | — |
 Respect | 2021 | $8.8M | $24.3M | 2.76x | $32.1M | A | 63% | #43 |
 Clerks II | 2006 | $10.1M | $24.1M | 2.40x | $27.3M | — | 63% | — |
 Network | 1976 | — | $23.7M | — | — | — | 91% | — |
 Vicky Cristina Barcelona | 2008 | $3.8M | $23.2M | 6.20x | $104.5M | — | 80% | — |
 Benny & Joon | 1993 | $3.3M | $23.2M | 6.10x | — | — | 75% | — |
 The Cutting Edge | 1992 | $4.5M | $23.1M | 5.20x | — | — | 59% | — |
 Fighting with My Family | 2019 | $139K | $23.0M | 2.90x | $41.5M | — | 93% | — |
 Bulletproof Monk | 2003 | $8.7M | $23.0M | 2.70x | $26.9M | — | 22% | — |
 Lucky Number Slevin | 2006 | $7.0M | $22.5M | 3.20x | $55.5M | — | 52% | — |
 Victor/Victoria | 1982 | $140K | $22.5M | 10.7x | — | — | 85% | — |
 Bowling for Columbine | 2002 | $209K | $21.6M | 13.9x | $58.2M | — | 95% | — |
 Quigley Down Under | 1990 | $3.9M | $21.4M | 5.60x | — | — | 52% | — |
 A Christmas Story | 1983 | $2.1M | $20.8M | — | — | — | 87% | — |
 Hart's War | 2002 | $7.8M | $19.1M | 2.50x | $33.1M | — | 60% | — |
 Operation Finale | 2018 | $6.0M | $17.6M | 2.90x | — | — | 60% | — |
 Cat on a Hot Tin Roof | 1958 | — | $17.6M | — | — | — | 97% | — |
 To Live and Die in L.A. | 1985 | $3.6M | $17.3M | 4.90x | — | — | 89% | — |
 The Covenant | 2023 | $6.4M | $16.9M | 2.70x | $20.7M | — | 82% | — |
 Original Sin | 2001 | $6.4M | $16.5M | 2.60x | $35.4M | — | 12% | — |
 Pink Floyd: The Wall | 1982 | $68K | $14.8M | — | — | — | 73% | — |
 North by Northwest | 1959 | — | $13.4M | — | $13.5M | — | 97% | — |
 Wicker Park | 2004 | $5.5M | $13.0M | 2.40x | $21.6M | — | 27% | — |
 Meet Me in St. Louis | 1944 | — | $12.8M | — | — | — | 99% | — |
 Shaft | 1971 | — | $12.1M | — | — | — | 88% | — |
 Bottoms | 2023 | $461K | $12.0M | 3.90x | $13.0M | — | 91% | — |
 The Year of Living Dangerously | 1982 | $35K | $10.3M | 6.00x | — | — | 88% | — |
 The Secret of NIMH | 1982 | $387K | $10.1M | — | — | — | 93% | — |
 Cutthroat Island | 1995 | $2.4M | $10.0M | 4.20x | $18.5M | — | 40% | — |
 Lolita | 1962 | — | $9.2M | — | — | — | 89% | — |
 Saved! | 2004 | $345K | $8.9M | 3.50x | $10.2M | — | 61% | — |
 Death at a Funeral | 2007 | $1.3M | $8.6M | 6.70x | $47.3M | — | 63% | — |
 The Manchurian Candidate | 1962 | — | $7.7M | — | — | — | 96% | — |
 Hackers | 1995 | $3.2M | $7.5M | 2.40x | — | — | 34% | — |
 Gigi | 1958 | — | $7.3M | — | — | — | 90% | — |
 Singin' in the Rain | 1952 | — | $7.3M | — | $7.3M | — | 100% | — |
 Where Eagles Dare | 1969 | — | $7.1M | — | — | — | 84% | — |
 Strange Brew | 1983 | — | $7.0M | — | — | — | 75% | — |
 9½ Weeks | 1986 | $329K | $6.7M | — | — | — | 58% | — |
 Ghost World | 2001 | $99K | $6.2M | 13.5x | $8.8M | — | 93% | — |
 Lars and the Real Girl | 2007 | $90K | $6.0M | 6.50x | $11.3M | — | 81% | — |
 Rescue Dawn | 2007 | $110K | $5.5M | 49.8x | $7.0M | — | 90% | — |
 Kelly's Heroes | 1970 | — | $5.2M | — | — | — | 79% | — |
 Of Mice and Men | 1992 | $98K | $5.1M | 52.1x | — | — | 97% | — |
 An American in Paris | 1951 | — | $4.5M | — | — | — | 95% | — |
 Forbidden Planet | 1956 | — | $3.0M | — | — | — | 93% | — |
 The Philadelphia Story | 1940 | — | $3.0M | — | $3.0M | — | 100% | — |
 24 Hour Party People | 2002 | $35K | $1.2M | 8.40x | $3.6M | — | 87% | — |
 The Passenger | 1975 | — | $620K | — | — | — | 88% | — |
 Hard Eight | 1996 | $69K | $142K | — | — | — | 82% | — |
 Soylent Green | 1973 | — | — | — | — | — | 73% | — |
 Westworld | 1973 | — | — | — | — | — | 83% | — |
 Get Carter | 1971 | — | — | — | — | — | 85% | — |
 The Boy Friend | 1971 | — | — | — | — | — | 0% | — |
 Zabriskie Point | 1970 | — | — | — | — | — | 64% | — |
 Gaslight | 1944 | — | — | — | — | — | 94% | — |
 The Shop Around the Corner | 1940 | — | — | — | — | — | 99% | — |
 The Thin Man | 1934 | — | — | — | — | — | 98% | — |
 Freaks | 1932 | — | — | — | — | — | 95% | — |
Click any column to sort. Yearly rank is the film’s place on its release year’s domestic chart; a film outside that year’s top 50 shows a dash.
Film by film
DomesticInternationalColumn height is worldwide
Profitability
Return on budget
2.9x
$7.372B worldwide on $2.570B of production budget
Theatrical breakeven point is approx. 2.5x production budget
Domestic vs international split
Domestic $3.687BInternational $3.685B
Return by film
Worldwide ÷ budget0x2.5x breakeven38.8x
Budgets are reported production costs and exclude marketing, so this is a gross-to-budget ratio rather than studio profit. Films with no reported budget, and streaming releases with no real theatrical run, are left out of this section entirely, including from the totals, rather than counted as zero.
Records held
All records#3Biggest Labor Day openingsHalloween$30.6M#6Biggest October openingsHalloween$76.2M#7Biggest horror openingsHalloween$76.2M#7Biggest Labor Day openingsJeepers Creepers$15.8M#9Biggest Thanksgiving openingsCreed II$56.0M#10Biggest February openingsHannibal$58.0M#12Biggest horror openingsHannibal$58.0M#14All-time G domesticGone with the Wind$198.7M#14Biggest April openingsClash of the Titans$61.2M#19Most weeks at #1Rocky IV6 weeks
Top 10 of 13 placings across 11 all-time charts. Where a film places on the same chart in consecutive weekends, only its best placing is shown.
What’s next
Full scheduleNo upcoming movies announced yet.
Connected
Directors
Counted from this filmography. The number is how many of these films each one accounts for.