
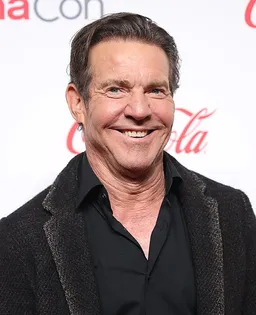
Actor
Dennis QuaidFollow
36 films•1979–2026•Drama · Comedy · Adventure
Avg critics53%
Avg audience65%
Avg domestic$42.5M
Domestic
$1.486B
Lifetime
Worldwide
$2.471B
Lifetime
Avg opening
$11.2M
3-day
Filmography
| Film | Year | Opening | Domestic | Legs | Worldwide | CinemaScore | RT | Yearly rank |
|---|---|---|---|---|---|---|---|---|
 The Day After Tomorrow | 2004 | $68.7M | $187.0M | 2.72x | $553.0M | B | 45% | #7 |
 I Can Only Imagine | 2018 | $17.1M | $83.5M | 4.88x | $85.8M | A | 69% | #39 |
 The Rookie | 2002 | $16.0M | $75.6M | 4.72x | $80.7M | A | 84% | #36 |
 Any Given Sunday | 1999 | $13.6M | $75.5M | 5.60x | $100.2M | B- | 51% | — |
 Vantage Point | 2008 | $22.9M | $72.3M | 3.16x | $152.0M | B- | 34% | #44 |
 The Parent Trap | 1998 | $11.1M | $66.3M | 5.90x | $84.0M | — | 86% | — |
 A Dog's Purpose | 2017 | $18.3M | $64.5M | 3.53x | $203.6M | A | 69% | #45 |
 Midway | 2019 | $17.9M | $56.8M | 3.17x | $126.8M | A- | 57% | #50 |
 Yours, Mine and Ours | 2005 | $17.5M | $53.4M | 3.10x | $72.4M | A- | 6% | — |
 Footloose | 2011 | $15.6M | $51.8M | 3.30x | $63.0M | A | 68% | — |
 Dragonheart | 1996 | $15.0M | $51.4M | 3.40x | $104.4M | B+ | 47% | — |
 Something to Talk About | 1995 | $11.1M | $50.9M | 4.60x | $77.3M | — | 33% | — |
 In Good Company | 2004 | $152K | $45.5M | 3.20x | $63.5M | — | 83% | — |
 Frequency | 2000 | $9.0M | $45.0M | 5.00x | $68.1M | — | 70% | — |
 Soul Surfer | 2011 | $10.6M | $43.9M | 4.10x | $47.1M | — | 45% | — |
 Jaws 3-D | 1983 | $13.4M | $42.2M | 3.10x | $84.7M | — | 10% | — |
 Legion | 2010 | $17.5M | $40.2M | 2.30x | $67.6M | — | 20% | — |
 Strange World | 2022 | $12.2M | $39.1M | 3.20x | $74.7M | A- | 43% | #38 |
 Postcards from the Edge | 1990 | $7.9M | $38.0M | 4.80x | — | — | 83% | — |
 Reagan | 2024 | $7.7M | $30.0M | 3.90x | $30.1M | A | 18% | #48 |
 American Underdog | 2021 | $5.9M | $26.5M | 4.50x | — | — | 75% | — |
 Wyatt Earp | 1994 | $7.5M | $25.1M | 3.30x | — | — | 33% | — |
 A Dog's Journey | 2019 | $8.0M | $22.8M | 2.80x | $78.9M | — | 53% | — |
 The Right Stuff | 1983 | $1.6M | $21.5M | 13.4x | — | — | 96% | — |
 Cold Creek Manor | 2003 | $8.2M | $21.4M | 2.60x | $29.1M | — | 12% | — |
 Flight of the Phoenix | 2004 | $5.0M | $21.0M | 4.20x | $34.0M | — | 30% | — |
 Breaking Away | 1979 | $18K | $20.0M | 1129.8x | — | — | 95% | — |
 Innerspace | 1987 | $4.7M | $19.8M | 4.20x | — | — | 81% | — |
 I Can Only Imagine 2 | 2026 | $7.8M | $18.6M | 2.40x | $19.0M | A+ | 63% | #58 |
 The Substance | 2024 | $3.2M | $17.6M | 5.50x | $77.3M | — | 89% | — |
 Far from Heaven | 2002 | $211K | $15.9M | 9.70x | $29.0M | — | 87% | — |
 Enemy Mine | 1985 | $1.6M | $12.3M | 7.70x | — | — | 61% | — |
 The Words | 2012 | $4.8M | $11.5M | 2.40x | $16.4M | — | 24% | — |
 Pandorum | 2009 | $4.4M | $10.3M | 2.30x | $17.0M | — | 26% | — |
 Movie 43 | 2013 | $4.8M | $8.8M | 1.80x | $31.2M | — | 5% | — |
 War Machine | 2026 | — | — | — | — | — | 66% | — |
Click any column to sort. Yearly rank is the film’s place on its release year’s domestic chart; a film outside that year’s top 50 shows a dash.
Film by film
0$250M$500M
DomesticInternationalColumn height is worldwide · one film every 1.3 years
Profitability
Return on budget
2.2x
$2.196B worldwide on $1.004B of production budget
Theatrical breakeven point is approx. 2.5x production budget
Domestic vs international split
Domestic $1.142BInternational $1.054B
Return by film
Worldwide ÷ budget0x2.5x breakeven12.3x
Budgets are reported production costs and exclude marketing, so this is a gross-to-budget ratio rather than studio profit. Films with no reported budget, and streaming releases with no real theatrical run, are left out of this section entirely, including from the totals, rather than counted as zero.
Records held
All records#3Biggest openings not at #1The Day After Tomorrow$68.7M#14Biggest Memorial Day openingsThe Day After Tomorrow$85.8M#14Biggest grossers never #1The Day After Tomorrow$186.7M#16Biggest Labor Day openingsReagan$10.3M
4 placings across 4 all-time charts. Where a film places on the same chart in consecutive weekends, only its best placing is shown.
What’s next
Full scheduleNo upcoming movies announced yet.
Connected
Counted from this filmography. The number is how many of these films each one accounts for.
Comparisons
Build your own


 Disney’s Thanksgiving originalsHexed vs Wish vs Strange World vs EncantoHexed opens November 25. Encanto opened to $27.2M and legged to $96.1M; Strange World ($12.2M, $39.1M) and Wish ($19.7M three-day, $64.0M) are the two misses it needs to avoid.


 Dog moviesHeart of the Beast vs Dog vs A Dog’s Purpose vs Marley & MeBrad Pitt’s Heart of the Beast opened with $7.5M on Friday, previews included — against Marley & Me’s $143.0M run, A Dog’s Purpose’s $64.5M and Dog’s $61.8M.