

Studio
Warner Bros.
310 films•1941–2026•Drama · Action · Adventure
65%average critics72%average audience$102.2Mdomestic average
Films
20
2001–2019
Domestic
$31.69B
lifetime
Worldwide
$75.14B
lifetime
Avg opening
$29.0M
3-day
Avg legs
3.99x
opening → total
Return
3.3x
on $22.18B of budget
Box Office Watch tracks 310 Warner Bros. releases from 1941 to 2026, together grossing $31.69B domestic and $75.14B worldwide. The biggest hit is Harry Potter and the Deathly Hallows: Part 2 (2011) at $1.34B worldwide, which also had the biggest opening weekend, $169.0M.
Filmography
| Film | Year | Opening | Domestic | Legs | Worldwide | CinemaScore | RT | Yearly rank |
|---|---|---|---|---|---|---|---|---|
 Joker Joker | 2019 | $96.2M | $335.5M | 3.49x | $1.08B | B+ | 68% | #9 |
 Aquaman Aquaman | 2018 | $67.9M | $335.1M | 4.94x | $1.15B | A- | 64% | #5 |
| Wonder Woman | 2017 | $103.3M | $412.6M | 3.99x | $823.0M | A | 92% | #3 |
 It It | 2017 | $123.4M | $327.5M | 2.66x | $704.1M | A- | 85% | #7 |
 Batman v Superman: Dawn of Justice Batman v Superman: Dawn of Justice | 2016 | $166.0M | $330.4M | 1.99x | $873.6M | A- | 27% | #8 |
 Suicide Squad Suicide Squad | 2016 | $133.7M | $325.1M | 2.43x | $749.2M | A- | 26% | #9 |
 American Sniper American Sniper | 2015 | $89.3M | $350.1M | 3.92x | $547.6M | A+ | 72% | #6 |
 Man of Steel Man of Steel | 2013 | $117.0M | $291.0M | 2.50x | $670.0M | A- | 56% | #5 |
| The Dark Knight Rises | 2012 | $161.0M | $448.0M | 2.79x | $1.08B | A | 87% | #2 |
 The Hobbit: An Unexpected Journey The Hobbit: An Unexpected Journey | 2012 | $84.6M | $303.0M | 3.58x | $1.02B | A | 64% | #5 |
| Harry Potter and the Deathly Hallows: Part 2 | 2011 | $169.0M | $381.0M | 2.25x | $1.34B | A | 96% | #1 |
 Harry Potter and the Deathly Hallows: Part 1 Harry Potter and the Deathly Hallows: Part 1 | 2010 | $125.0M | $296.0M | 2.37x | $960.0M | A | 76% | #5 |
 Inception Inception | 2010 | $62.8M | $293.0M | 4.66x | $828.0M | B+ | 87% | #6 |
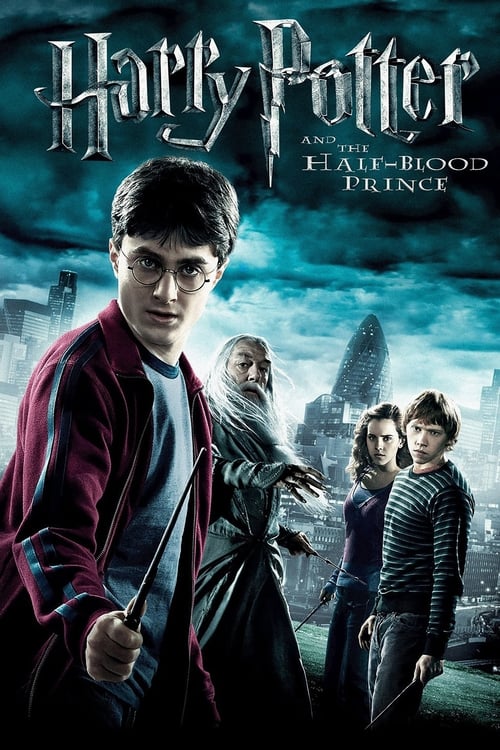 Harry Potter and the Half-Blood Prince Harry Potter and the Half-Blood Prince | 2009 | $77.8M | $302.0M | 3.88x | $934.0M | A- | 83% | #3 |
 The Hangover The Hangover | 2009 | $45.0M | $277.0M | 6.17x | $469.0M | A | 79% | #6 |
| The Dark Knight | 2008 | $158.0M | $533.0M | 3.37x | $1.00B | A | 94% | #1 |
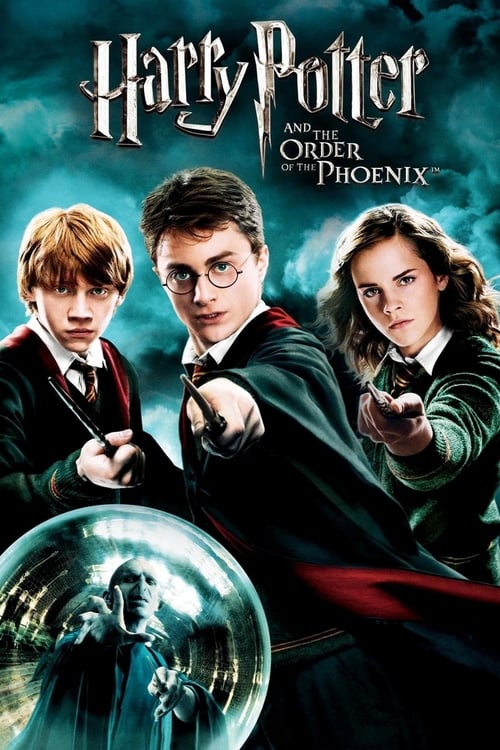 Harry Potter and the Order of the Phoenix Harry Potter and the Order of the Phoenix | 2007 | $77.1M | $292.0M | 3.79x | $942.0M | A- | 78% | #5 |
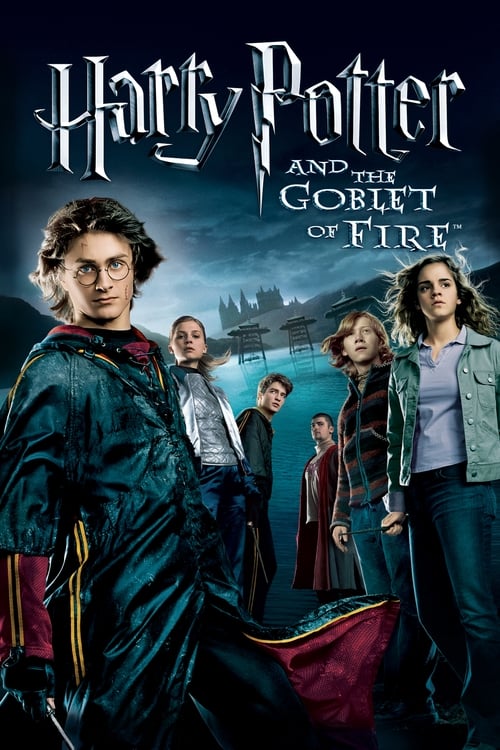 Harry Potter and the Goblet of Fire Harry Potter and the Goblet of Fire | 2005 | $103.0M | $290.0M | 2.82x | $896.0M | A | 88% | #3 |
 The Matrix Reloaded The Matrix Reloaded | 2003 | $91.8M | $282.0M | 3.07x | $739.0M | B+ | 74% | #4 |
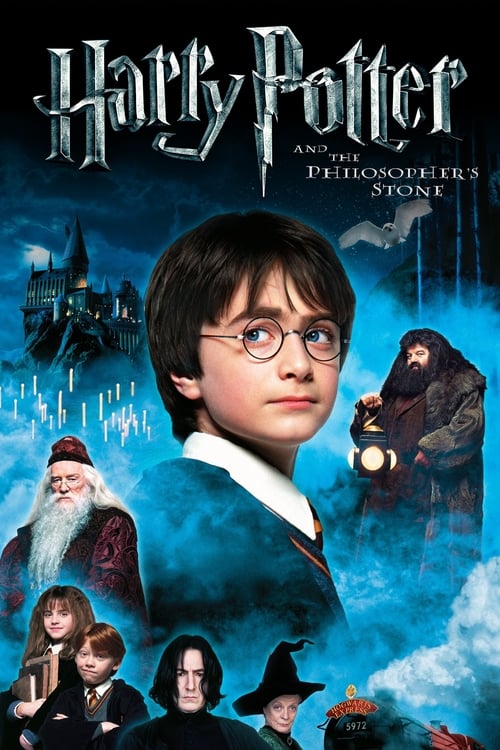 Harry Potter and the Sorcerer's Stone Harry Potter and the Sorcerer's Stone | 2001 | $90.3M | $318.0M | 3.52x | $975.0M | A | 80% | #1 |
Click any column to sort. Yearly rank is the film’s place on its release year’s domestic chart; a film outside that year’s top 50 shows a dash.
Film by film
Harry Potter and the Sorcerer's Stone2001The Matrix Reloaded2003Harry Potter and the Goblet of Fire2005Harry Potter and the Order of the Phoenix2007The Dark Knight2008Harry Potter and the Half-Blood Prince2009The Hangover2009Harry Potter and the Deathly Hallows: Part 12010Inception2010Harry Potter and the Deathly Hallows: Part 22011The Dark Knight Rises2012The Hobbit: An Unexpected Journey2012Man of Steel2013American Sniper2015Batman v Superman: Dawn of Justice2016Suicide Squad2016Wonder Woman2017It2017Aquaman2018Joker2019DomesticInternationalColumn height is worldwide
Profitability
Return on Budget
3.3x
$74.03B worldwide on $22.18B of production budget
Theatrical breakeven point is approx. 2.5x production budget
Domestic vs International Split
Domestic $30.72BInternational $43.31B
Return by film · worldwide ÷ budget
0x2.5x breakeven20.1x
Budgets are reported production costs and exclude marketing, so this is a gross-to-budget ratio rather than studio profit. Films with no reported budget are left out of this section entirely, including from the totals, rather than counted as zero.
Records held
All records →#1Biggest 4th weekendsAmerican Sniper$89.3M#1Biggest horror openingsIt$123.4M#2Biggest horror openingsIt: Chapter Two$91.1M#5Biggest R openingsIt$123.4M#5All-time R domesticAmerican Sniper$350.1M#5Biggest 7th weekendsGran Torino$16.2M#6Biggest R openingsJoker$96.2M#6All-time R domesticJoker$335.5M#6Biggest horror openingsI Am Legend$77.2M#7Biggest R openingsThe Matrix Reloaded$91.8M
Top 10 of 62 placings across 20 all-time charts. Where a film places on the same chart in consecutive weekends, only its best placing is shown.
What’s next
Full schedule →SEP 11
Practical Magic 2
Warner Bros.
$33M – $44M
Opening Range
OCT 2
Digger
Warner Bros.
$20M – $29M
Opening Range
OCT 23
Clayface
Warner Bros.
Tracking TBD
Updated Weekly
NOV 6
The Cat in the Hat
Warner Bros.
Tracking TBD
Updated Weekly
DEC 18
Dune: Part Three
Warner Bros.
Tracking TBD
Updated Weekly
JAN 22
Animal Friends
Warner Bros.
Tracking TBD
Updated Weekly


Connected
Directors
Counted from this filmography. The number is how many of these films each one accounts for.
Related news
All analysis →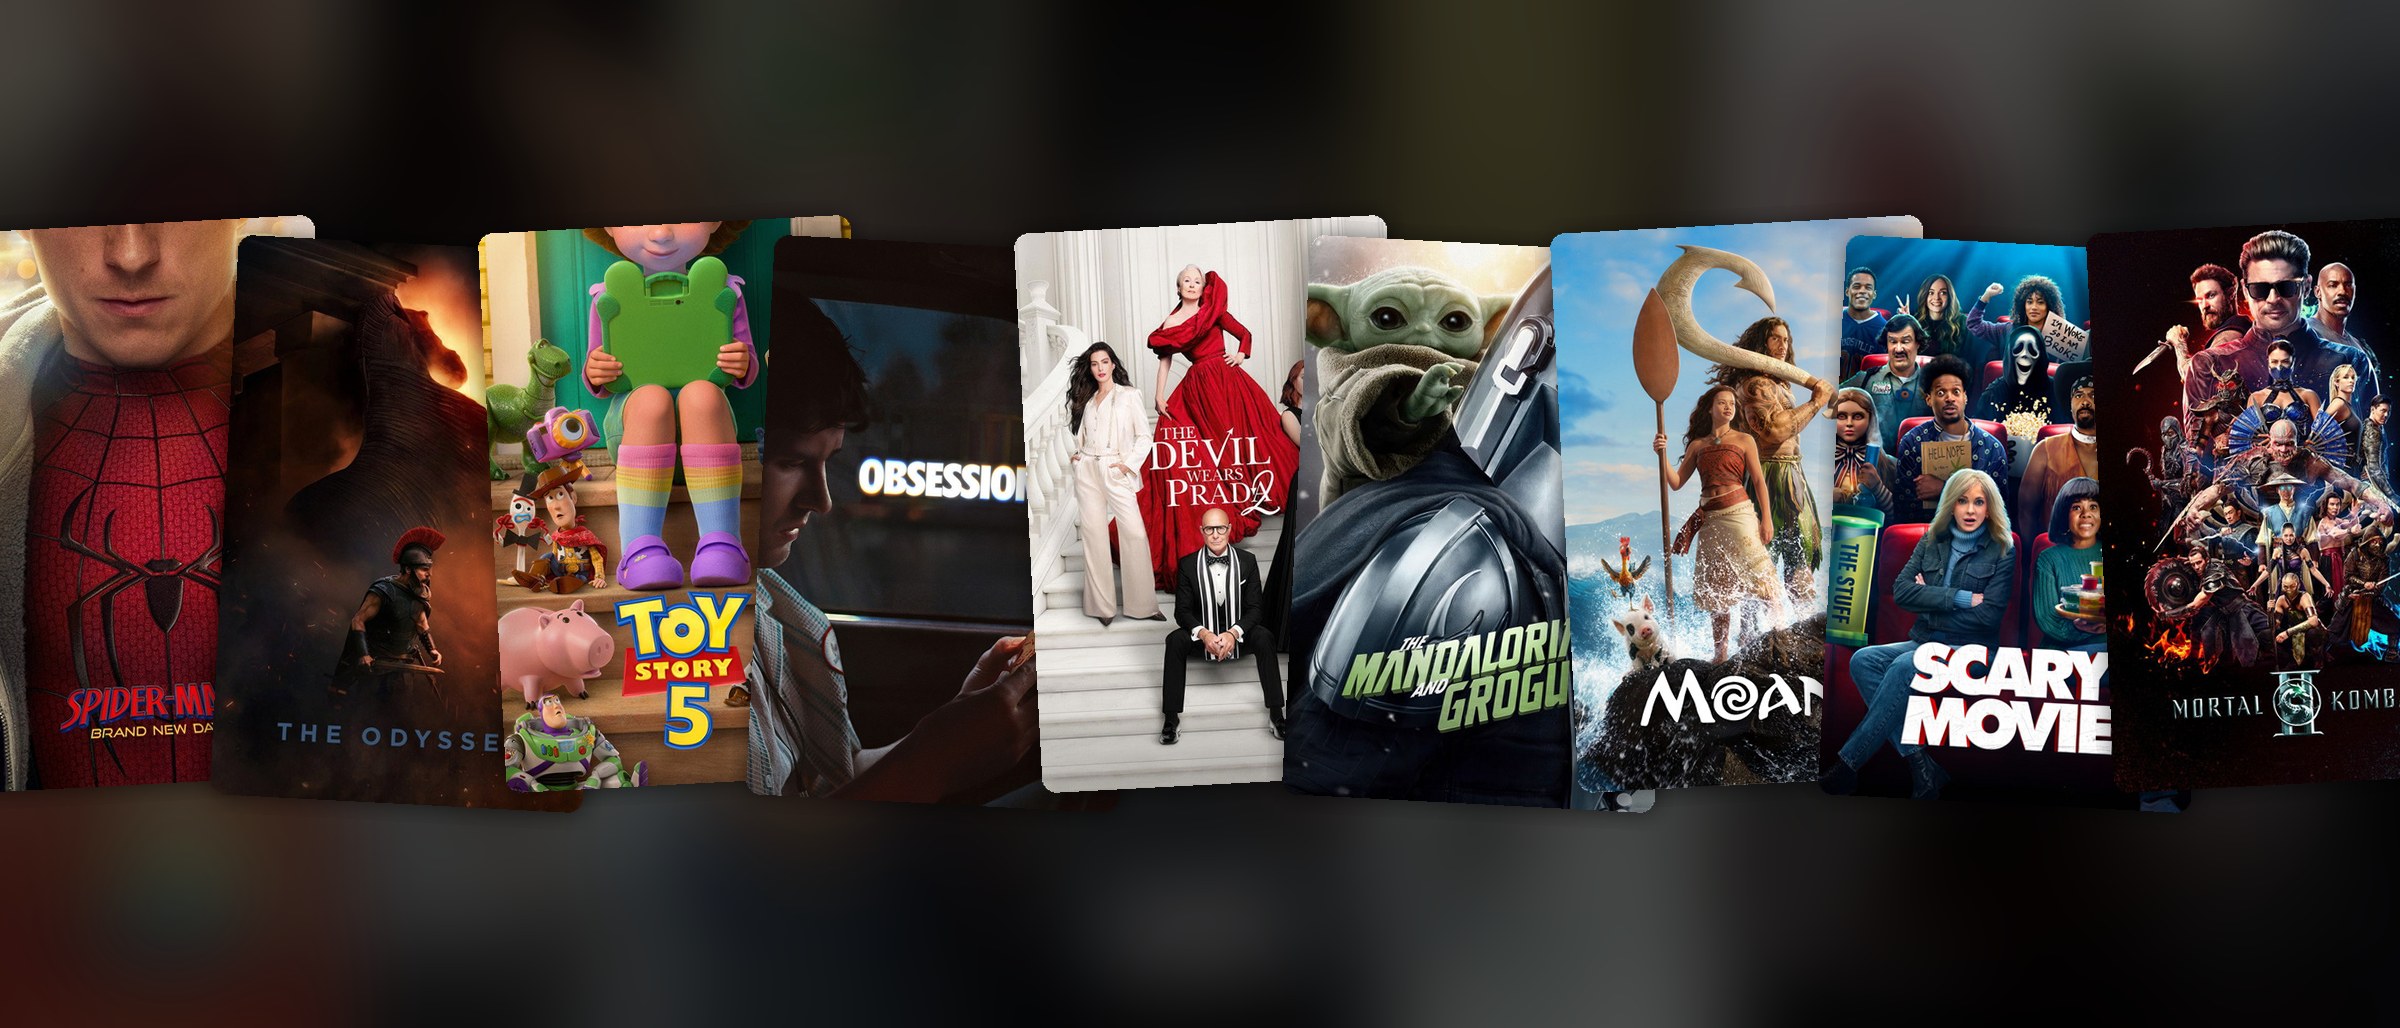 Special Coverage · Summer 2026Summer 2026 Recap: the hits, the flops, the breakouts, and the winners and losers of the seasonAugust 20, 2026
 Week 30 · RecapThe Odyssey posts $90M on a 27% hold, best of Nolan's career; $289.4M in 10 days puts $500M in viewJuly 24–26, 2026
 Week 32 · RecapBrand New Day’s $145M second weekend is third-biggest ever; Odyssey clears $1.1BAugust 7–9, 2026
Comparisons
Build your own →


 Complete SagaHarry Potter: Years 1–4Sorcerer’s Stone through Goblet of Fire — the wizarding world’s first act, day by day.


 Complete SagaHarry Potter: Years 5–8Order of the Phoenix through Deathly Hallows Part 2’s record finale.

 Complete TrilogyThe Nolan Batman TrilogyBatman Begins’ $48.7M start to The Dark Knight’s $158.4M explosion.

 Complete TrilogyThe Hobbit TrilogyMiddle-earth’s second run, with An Unexpected Journey out in front.