

Actor
Robert PattinsonFollow
22 films•2005–2026•Drama · Adventure · Fantasy
Avg critics67%
Avg audience68%
Avg domestic$141.0M
Domestic
$2.960B
Lifetime
Worldwide
$7.648B
Lifetime
Avg opening
$48.5M
3-day
Filmography
| Film | Year | Opening | Domestic | Legs | Worldwide | CinemaScore | RT | Yearly rank |
|---|---|---|---|---|---|---|---|---|
 The Odyssey The Odyssey | 2026 | $123.5M | $625.4M | 5.10x | $1.792B | A | 96% | #2 |
 The Batman The Batman | 2022 | $134.0M | $369.6M | 2.80x | $772.5M | A | 85% | #7 |
 The Twilight Saga: Eclipse The Twilight Saga: Eclipse | 2010 | $64.8M | $300.8M | 4.64x | $705.1M | — | 46% | #4 |
 The Twilight Saga: New Moon The Twilight Saga: New Moon | 2009 | $143.0M | $297.2M | 2.08x | $688.1M | — | 28% | #4 |
 The Twilight Saga: Breaking Dawn - Part 2 The Twilight Saga: Breaking Dawn - Part 2 | 2012 | $141.0M | $292.9M | 2.08x | $830.3M | A | 49% | #6 |
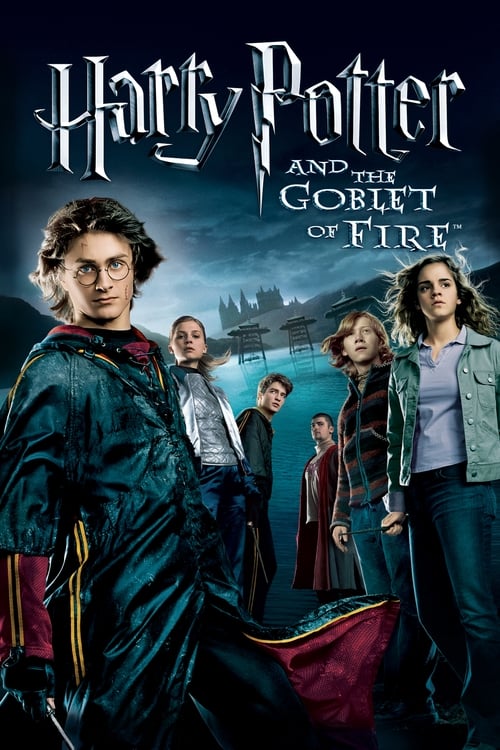 Harry Potter and the Goblet of Fire Harry Potter and the Goblet of Fire | 2005 | $103.0M | $292.0M | 2.83x | $886.8M | A | 88% | #3 |
 The Twilight Saga: Breaking Dawn - Part 1 The Twilight Saga: Breaking Dawn - Part 1 | 2011 | $138.0M | $281.8M | 2.04x | $682.4M | B+ | 26% | #3 |
 Twilight Twilight | 2008 | $69.6M | $194.3M | 2.79x | $403.7M | A- | 48% | #7 |
 Water for Elephants Water for Elephants | 2011 | $16.8M | $58.7M | 3.50x | $116.8M | A- | 60% | — |
 Tenet Tenet | 2020 | $20.2M | $58.5M | 2.90x | $365.3M | B | 70% | #9 |
 The Drama The Drama | 2026 | $14.4M | $48.1M | 3.30x | $105.1M | B | 77% | #34 |
 Primetime Primetime | 2026 | $18.8M | $46.5M | 2.50x | $48.0M | B | 87% | #37 |
 Mickey 17 Mickey 17 | 2025 | $19.0M | $46.1M | 2.40x | $133.5M | B | 77% | #43 |
 Remember Me Remember Me | 2010 | $8.1M | $19.1M | 2.40x | $56.5M | — | 26% | — |
 The Lighthouse The Lighthouse | 2019 | $428K | $10.9M | 3.60x | $18.3M | — | 90% | — |
 The Lost City of Z The Lost City of Z | 2017 | $110K | $8.6M | 4.10x | $19.4M | — | 85% | — |
 Die My Love Die My Love | 2025 | $2.6M | $5.5M | 2.10x | $10.4M | — | 74% | — |
 Good Time Good Time | 2017 | $125K | $2.0M | 3.50x | $4.1M | — | 91% | — |
 The Rover The Rover | 2014 | $69K | $1.1M | 2.30x | $3.2M | — | 67% | — |
 Cosmopolis Cosmopolis | 2012 | — | $744K | — | $6.9M | — | 67% | — |
 Maps to the Stars Maps to the Stars | 2014 | $143K | $351K | 2.40x | — | — | 62% | — |
 The Devil All the Time The Devil All the Time | 2020 | — | — | — | — | — | 65% | — |
Click any column to sort. Yearly rank is the film’s place on its release year’s domestic chart; a film outside that year’s top 50 shows a dash.
Film by film
0$500M$1B$1.5B
DomesticInternationalColumn height is worldwide · one film every 1.0 years
Profitability
Return on budget
5.0x
$7.627B worldwide on $1.528B of production budget
Theatrical breakeven point is approx. 2.5x production budget
Domestic vs international split
Domestic $2.952BInternational $4.675B
Return by film
Worldwide ÷ budget0x2.5x breakeven13.8x
Budgets are reported production costs and exclude marketing, so this is a gross-to-budget ratio rather than studio profit. Films with no reported budget, and streaming releases with no real theatrical run, are left out of this section entirely, including from the totals, rather than counted as zero.
Records held
All records#1Best second-weekend holds ($100M+ openers)The Odyssey−27.1%#2All-time R domesticThe Odyssey$625.4M#4Biggest R openingsThe Odyssey$123.5M#4Biggest November openingsThe Twilight Saga: New Moon$142.8M#5Biggest March openingsThe Batman$134.0M#5Biggest November openingsThe Twilight Saga: Breaking Dawn - Part 2$141.1M#7Biggest November openingsThe Twilight Saga: Breaking Dawn - Part 1$138.1M#12Biggest July 4th openingsThe Twilight Saga: Eclipse$64.8M#13Biggest November openingsHarry Potter and the Goblet of Fire$102.7M#17Best second-weekend holds ($100M+ openers)Harry Potter and the Goblet of Fire−46.7%
Top 10 of 29 placings across 21 all-time charts. Where a film places on the same chart in consecutive weekends, only its best placing is shown.
What’s next
Full scheduleNo upcoming movies announced yet.
Connected
Counted from this filmography. The number is how many of these films each one accounts for.
Related news
All analysis Week 30 · RecapThe Odyssey posts $90M on a 27% hold, best of Nolan's career; $289.4M in 10 days puts $500M in viewJuly 24–26, 2026
 Week 29 · RecapThe Odyssey opens to $123.5M — Nolan's biggest debut outside the Dark Knight trilogyJuly 17–19, 2026
 Week 39 · RecapEndgame Encore wins a $118M weekend with $26M; Resident Evil crosses $100MSeptember 25–27, 2026
Comparisons
Build your own


 Complete sagaThe Twilight SagaTwilight through Breaking Dawn Part 2 — the four biggest bites of the saga.


 A24’s wide hitsPrimetime vs The Drama vs Civil War vs Talk to MeRobert Pattinson’s Primetime opened with $8.5M on Friday, previews included — against A24 hits of a similar size: his own The Drama ($14.4M opening, $48.1M final), Civil War ($25.5M, $68.8M) and Talk to Me ($10.4M, $48.3M).


 Top-tier blockbustersThe Odyssey vs top-tier blockbustersThe Odyssey’s pace against Deadpool & Wolverine, Barbie, and The Dark Knight.


 Complete sagaHarry Potter: Years 1–4Sorcerer’s Stone through Goblet of Fire — the wizarding world’s first act, day by day.