


Franchise
James BondFollow
27 films•1962–2021•United Artists, MGM/UA
Avg critics70%
Avg audience64%
Avg domestic$85.1M
Domestic
$2.298B
Lifetime
Worldwide
$7.878B
Lifetime
Avg opening
$19.4M
3-day
Filmography
| Film | Year | Opening | Domestic | Legs | Worldwide | CinemaScore | RT | Yearly rank |
|---|---|---|---|---|---|---|---|---|
| Skyfall | 2012 | $88.4M | $304.4M | 3.44x | $1.111B | A | 92% | #4 |
| Spectre | 2015 | $70.4M | $200.1M | 2.84x | $879.1M | A- | 63% | #11 |
| Quantum of Solace | 2008 | $67.5M | $169.4M | 2.51x | $591.7M | A | 63% | #9 |
| Casino Royale | 2006 | $40.8M | $167.4M | 4.10x | $594.4M | A- | 94% | #9 |
 No Time to Die | 2021 | $56.0M | $160.9M | 2.90x | $758.9M | A | 83% | #8 |
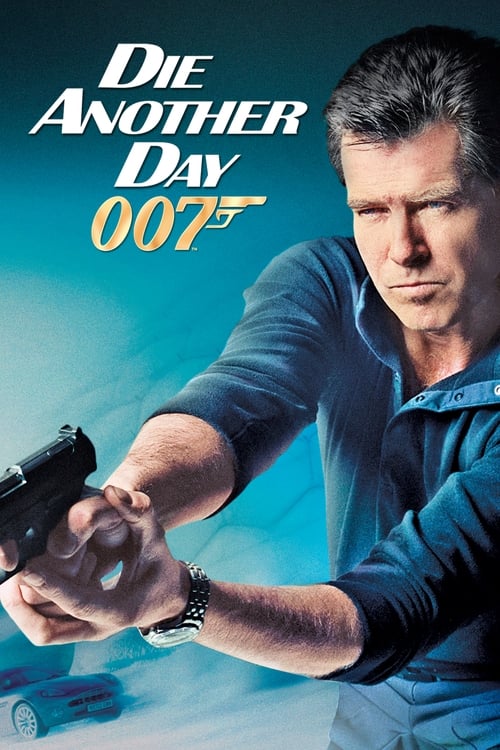 Die Another Day | 2002 | $47.1M | $160.9M | 3.42x | $431.9M | A- | 55% | #11 |
 The World Is Not Enough | 1999 | $35.5M | $126.9M | 3.60x | $361.7M | — | 51% | — |
 Tomorrow Never Dies | 1997 | $25.1M | $125.3M | 5.00x | $339.5M | — | 58% | — |
 GoldenEye | 1995 | $26.2M | $106.4M | 3.84x | $356.4M | A- | 80% | — |
 Moonraker | 1979 | $7.1M | $70.3M | 9.90x | $210.3M | — | 59% | — |
 Octopussy | 1983 | $8.9M | $67.9M | 7.60x | $187.5M | — | 41% | — |
 Thunderball | 1965 | — | $63.6M | — | $141.2M | — | 85% | — |
 Never Say Never Again | 1983 | $11.0M | $55.5M | 5.10x | $160.0M | — | 71% | — |
 For Your Eyes Only | 1981 | $6.8M | $54.8M | 8.00x | $195.3M | — | 69% | — |
 The Living Daylights | 1987 | $11.1M | $51.2M | 4.60x | $191.2M | — | 75% | — |
 Goldfinger | 1964 | — | $51.1M | — | $124.9M | — | 99% | — |
 A View to a Kill | 1985 | $13.3M | $50.3M | 3.80x | $152.6M | — | 36% | — |
 The Spy Who Loved Me | 1977 | — | $46.8M | — | $185.4M | — | 82% | — |
 Diamonds Are Forever | 1971 | — | $43.8M | — | $116.0M | — | 64% | — |
 You Only Live Twice | 1967 | — | $43.1M | — | $111.6M | — | 73% | — |
 Live and Let Die | 1973 | — | $35.4M | — | $161.8M | — | 67% | — |
 Licence to Kill | 1989 | $8.8M | $34.7M | 4.00x | $156.2M | — | 79% | — |
 From Russia with Love | 1963 | — | $24.8M | — | $78.9M | — | 97% | — |
 On Her Majesty's Secret Service | 1969 | — | $22.8M | — | $82.0M | — | 81% | — |
 Casino Royale | 1967 | — | $22.7M | — | $41.7M | — | 26% | — |
 The Man with the Golden Gun | 1974 | — | $21.0M | — | $97.6M | — | 40% | — |
 Dr. No | 1962 | — | $16.1M | — | $59.6M | — | 95% | — |
Click any column to sort. Yearly rank is the film’s place on its release year’s domestic chart; a film outside that year’s top 50 shows a dash.
Film by film
0$500M$1B
DomesticInternationalColumn height is worldwide · one film every 2.3 years
Profitability
Return on budget
4.4x
$7.878B worldwide on $1.806B of production budget
Theatrical breakeven point is approx. 2.5x production budget
Domestic vs international split
Domestic $2.298BInternational $5.581B
Return by film
Worldwide ÷ budget0x2.5x breakeven59.6x
Budgets are reported production costs and exclude marketing, so this is a gross-to-budget ratio rather than studio profit. Films with no reported budget, and streaming releases with no real theatrical run, are left out of this section entirely, including from the totals, rather than counted as zero.
Records held
All records#9Biggest October openingsNo Time to Die$55.2M#18Biggest November openingsSkyfall$88.4M#41Biggest worldwide runsSkyfall$1.111B
3 placings across 3 all-time charts. Where a film places on the same chart in consecutive weekends, only its best placing is shown.
What’s next
Full scheduleNo upcoming movies announced yet.
Connected
Counted from this filmography. The number is how many of these films each one accounts for.


