

Actor & Director
Andy SerkisFollow
16 films•2 as director•2002–2026•Drama · Adventure · Action
Avg critics73%
Avg audience77%
Avg domestic$133.2M
Domestic
$1.998B
Lifetime
Worldwide
$5.609B
Lifetime
Avg opening
$36.5M
3-day
Filmography
| Film | Year | Opening | Domestic | Legs | Worldwide | CinemaScore | RT | Yearly rank |
|---|---|---|---|---|---|---|---|---|
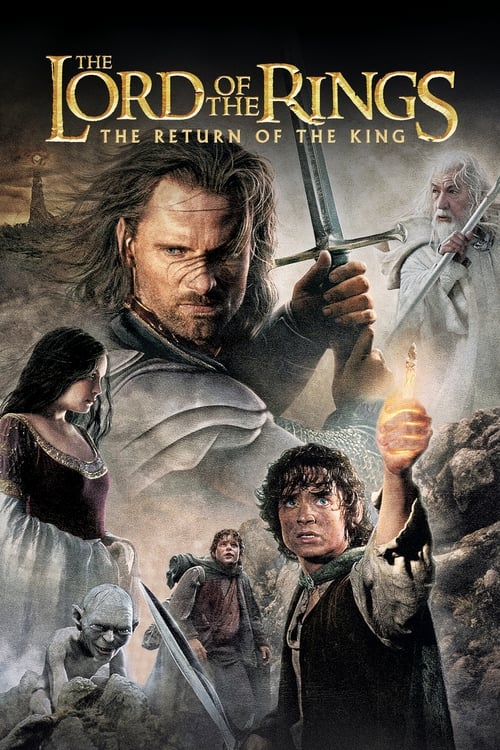 The Lord of the Rings: The Return of the King The Lord of the Rings: The Return of the King | 2003 | $72.6M | $383.4M | 5.28x | $1.126B | A+ | 94% | #1 |
 The Lord of the Rings: The Two Towers The Lord of the Rings: The Two Towers | 2002 | $62.0M | $349.7M | 5.64x | $926.8M | A | 95% | #2 |
 King Kong King Kong | 2005 | $50.1M | $218.0M | 4.35x | $557.0M | A- | 84% | #5 |
 Venom: Let There Be Carnage Venom: Let There Be Carnage | 2021 | $90.1M | $213.6M | 2.40x | $501.5M | B+ | 67% | #3 |
 Dawn of the Planet of the Apes Dawn of the Planet of the Apes | 2014 | $72.6M | $208.5M | 2.87x | $710.6M | A | 91% | #11 |
 Rise of the Planet of the Apes Rise of the Planet of the Apes | 2011 | $54.8M | $176.8M | 3.23x | $471.0M | A- | 82% | #11 |
 War for the Planet of the Apes War for the Planet of the Apes | 2017 | $56.3M | $146.9M | 2.61x | $489.6M | A | 93% | #22 |
 The Adventures of Tintin The Adventures of Tintin | 2011 | $9.7M | $77.6M | 7.98x | $374.0M | A- | 75% | #43 |
 Flushed Away Flushed Away | 2006 | $18.8M | $64.7M | 3.44x | $178.0M | B+ | 72% | #41 |
 13 Going on 30 13 Going on 30 | 2004 | $21.1M | $57.1M | 2.70x | $97.7M | — | 65% | — |
 Young Washington Young Washington | 2026 | $19.4M | $47.1M | 2.40x | $47.2M | A | 59% | #35 |
 Long Shot Long Shot | 2019 | $9.7M | $30.3M | 3.10x | $53.6M | — | 0% | — |
 Inkheart Inkheart | 2009 | $7.6M | $17.3M | 2.30x | $66.7M | — | 38% | — |
 Animal Farm Animal Farm | 2026 | $3.3M | $5.5M | 1.70x | $5.5M | C- | 24% | #93 |
 24 Hour Party People 24 Hour Party People | 2002 | $35K | $1.2M | 8.40x | $3.6M | — | 87% | — |
 Luther: The Fallen Sun Luther: The Fallen Sun | 2023 | — | — | — | — | — | 68% | — |
Click any column to sort. Yearly rank is the film’s place on its release year’s domestic chart; a film outside that year’s top 50 shows a dash.
Film by film
DomesticInternationalColumn height is worldwide · one film every 1.6 years
Profitability
Return on budget
4.1x
$5.600B worldwide on $1.361B of production budget
Theatrical breakeven point is approx. 2.5x production budget
Domestic vs international split
Domestic $1.991BInternational $3.609B
Return by film
Worldwide ÷ budget0x2.5x breakeven12.0x
Budgets are reported production costs and exclude marketing, so this is a gross-to-budget ratio rather than studio profit. Films with no reported budget, and streaming releases with no real theatrical run, are left out of this section entirely, including from the totals, rather than counted as zero.
Records held
All records#3Biggest October openingsVenom: Let There Be Carnage$90.0M#4Best second-weekend holds ($50M+ openers)The Lord of the Rings: The Two Towers−21.2%#6Best multipliersThe Lord of the Rings: The Two Towers5.64x#9Best multipliersThe Lord of the Rings: The Return of the King5.19x#9Biggest August openingsRise of the Planet of the Apes$54.8M#12Biggest December openingsThe Lord of the Rings: The Return of the King$72.6M#17Biggest December openingsThe Lord of the Rings: The Two Towers$62.0M#17Best second-weekend holds ($50M+ openers)The Lord of the Rings: The Return of the King−30.3%
Top 8 of 9 placings across 6 all-time charts. Where a film places on the same chart in consecutive weekends, only its best placing is shown.
What’s next
Full scheduleNo upcoming movies announced yet.
Connected
Counted from this filmography. The number is how many of these films each one accounts for.
Related news
All analysis Week 27 · RecapMinions & Monsters opens way below the franchise average; Toy Story past $366M; Young Washington breaks out at $20.8M; Supergirl craters -74%July 3–5, 2026
 Long-Range · July 2026July 2026 preview: Minions, Moana and MythsJune 24, 2026
 Week 28 · RecapMoana bombs with a $43M opening on a $250M budget; Toy Story 5 passes $400M; Michael crosses $1BJuly 10–12, 2026

