
Actor
Anthony MackieFollow
21 films•2006–2026•Drama · Action · Crime
Avg critics56%
Avg audience64%
Avg domestic$74.6M
Domestic
$1.491B
Lifetime
Worldwide
$3.559B
Lifetime
Avg opening
$27.7M
3-day
Filmography
| Film | Year | Opening | Domestic | Legs | Worldwide | CinemaScore | RT | Yearly rank |
|---|---|---|---|---|---|---|---|---|
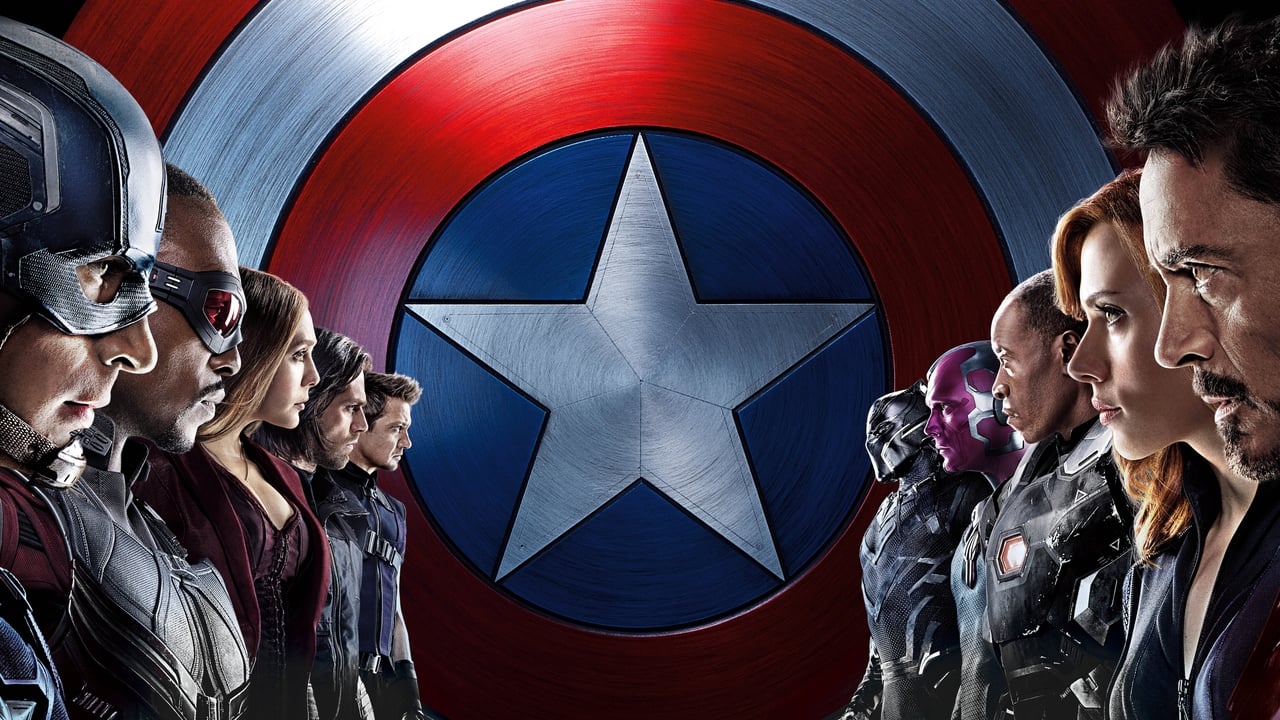
 Captain America: Civil War | 2016 | $179.1M | $408.1M | 2.28x | $1.152B | A | 91% | #3 |
 Captain America: The Winter Soldier | 2014 | $95.0M | $259.7M | 2.73x | $714.4M | A | 90% | #4 |
 Captain America: Brave New World | 2025 | $88.8M | $200.5M | 2.26x | $415.1M | B- | 46% | #11 |
 Eagle Eye | 2008 | $29.2M | $101.0M | 3.48x | $179.0M | B+ | 27% | #27 |
 Real Steel | 2011 | $27.3M | $85.5M | 3.13x | $299.0M | A | 60% | #34 |
 The Adjustment Bureau | 2011 | $21.2M | $62.5M | 3.00x | $126.9M | — | 71% | — |
 Pain & Gain | 2013 | $20.2M | $49.9M | 2.50x | $81.3M | — | 49% | — |
 Gangster Squad | 2013 | $17.1M | $46.0M | 2.70x | $104.1M | — | 30% | — |
 We Are Marshall | 2006 | $6.1M | $43.5M | 7.10x | — | — | 48% | — |
 The Night Before | 2015 | $9.9M | $43.0M | 4.40x | $52.6M | — | 69% | — |
 Abraham Lincoln: Vampire Hunter | 2012 | $16.3M | $37.5M | 2.30x | $137.5M | — | 34% | — |
 Notorious | 2009 | $20.5M | $36.8M | 1.80x | $45.0M | — | 52% | — |
 The Hate U Give | 2018 | $512K | $29.7M | 3.90x | $35.1M | — | 97% | — |
 Runner Runner | 2013 | $7.7M | $19.3M | 2.50x | $60.5M | — | 8% | — |
 Man on a Ledge | 2012 | $8.0M | $18.6M | 2.30x | $49.6M | — | 31% | — |
 The Hurt Locker | 2009 | $145K | $17.0M | — | $49.9M | — | 96% | — |
 Detroit | 2017 | $350K | $16.8M | 2.40x | $26.0M | — | 82% | — |
 Triple 9 | 2016 | $6.1M | $12.6M | 2.10x | $25.9M | — | 54% | — |
 Half Nelson | 2006 | $54K | $2.7M | 9.30x | $4.9M | — | 91% | — |
 Desert Warrior | 2026 | $488K | $666K | 1.40x | — | — | 25% | #143 |
 The Woman in the Window | 2021 | — | — | — | — | — | 25% | — |
Click any column to sort. Yearly rank is the film’s place on its release year’s domestic chart; a film outside that year’s top 50 shows a dash.
Film by film
DomesticInternationalColumn height is worldwide · one film every 1.0 years
Profitability
Return on budget
2.7x
$3.559B worldwide on $1.308B of production budget
Theatrical breakeven point is approx. 2.5x production budget
Domestic vs international split
Domestic $1.447BInternational $2.112B
Return by film
Worldwide ÷ budget0x2.5x breakeven7.0x
Budgets are reported production costs and exclude marketing, so this is a gross-to-budget ratio rather than studio profit. Films with no reported budget, and streaming releases with no real theatrical run, are left out of this section entirely, including from the totals, rather than counted as zero.
Records held
All records#4Biggest February openingsCaptain America: Brave New World$88.8M#4Biggest May openingsCaptain America: Civil War$179.1M#10Biggest April openingsCaptain America: The Winter Soldier$95.0M#13Biggest PG-13 openingsCaptain America: Civil War$179.1M#16Biggest opening weekendsCaptain America: Civil War$179.1M
Top 5 of 7 placings across 7 all-time charts. Where a film places on the same chart in consecutive weekends, only its best placing is shown.
What’s next
Full scheduleConnected
Counted from this filmography. The number is how many of these films each one accounts for.