
Actor
John Hurt
22 films•1978–2016•Drama · Adventure · Fantasy
70%average critics71%average audience$46.5Mdomestic average
Films
22
1978–2016
Domestic
$1.02B
lifetime
Worldwide
$2.38B
lifetime
Avg opening
$11.9M
3-day
Avg legs
4.82x
opening → total
Return
2.7x
on $860.4M of budget
Filmography
| Film | Year | Opening | Domestic | Legs | Worldwide | CinemaScore | RT | Yearly rank |
|---|---|---|---|---|---|---|---|---|
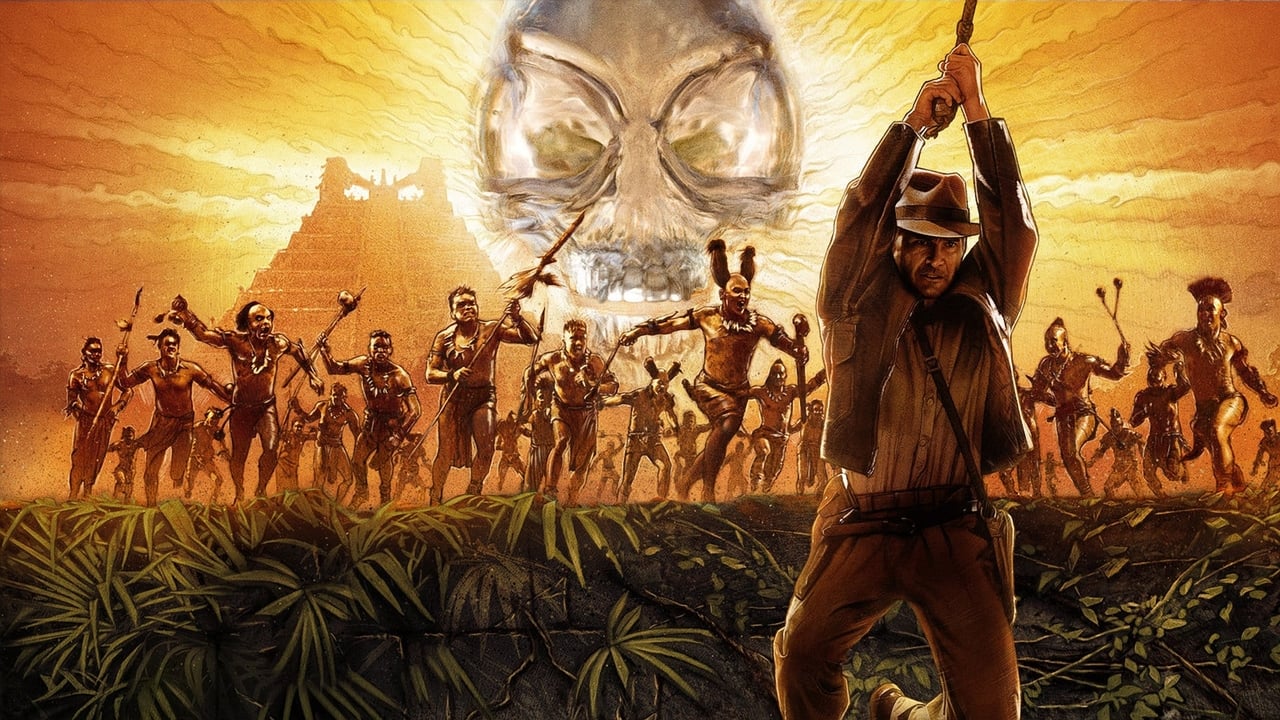
 Indiana Jones and the Kingdom of the Crystal Skull | 2008 | $100.0M | $317.1M | 3.17x | $786.6M | B | 77% | #3 |
 Contact | 1997 | $20.6M | $100.9M | 4.90x | $165.9M | — | 69% | — |
 Immortals | 2011 | $32.2M | $83.5M | 2.59x | $227.0M | B | 50% | #37 |
 Hercules | 2014 | $29.8M | $72.7M | 2.40x | $243.4M | — | 58% | — |
 V for Vendetta | 2006 | $25.6M | $70.5M | 2.75x | $133.0M | — | 73% | #36 |
 Alien | 1979 | $3.5M | $65.4M | — | $188.0M | — | 93% | — |
 Hellboy | 2004 | $23.2M | $59.6M | 2.57x | $99.8M | B- | 81% | #48 |
 The Skeleton Key | 2005 | $16.1M | $47.9M | 3.00x | $92.3M | — | 38% | — |
 Midnight Express | 1978 | — | $35.0M | — | — | — | 90% | — |
 Rob Roy | 1995 | $2.0M | $31.4M | 4.40x | — | — | 73% | — |
 The Lord of the Rings | 1978 | $627K | $27.0M | 43.1x | — | — | 48% | — |
 The Elephant Man | 1980 | — | $26.0M | — | $26.0M | — | 91% | — |
 Captain Corelli's Mandolin | 2001 | $7.2M | $25.5M | 3.50x | $62.1M | — | 28% | — |
 Tinker Tailor Soldier Spy | 2011 | $311K | $24.1M | 4.40x | $81.4M | — | 84% | — |
 Jackie | 2016 | $279K | $14.0M | 9.00x | $36.6M | — | 87% | — |
 1984 | 1984 | $89K | $8.4M | 6.50x | — | — | 76% | — |
 Snowpiercer | 2014 | $171K | $4.6M | 4.60x | $82.8M | — | 94% | — |
 Heaven's Gate | 1980 | — | $3.5M | — | $3.5M | — | 57% | — |
 Perfume: The Story of a Murderer | 2006 | $592K | $2.2M | 3.80x | $133.6M | — | 59% | — |
 Only Lovers Left Alive | 2013 | $88K | $1.9M | 9.50x | $3.1M | — | 86% | — |
 Dogville | 2004 | $89K | $1.5M | 7.50x | $14.9M | — | 70% | — |
 Dead Man | 1995 | $105K | $1.0M | 7.30x | $1.1M | — | 69% | — |
Click any column to sort. Yearly rank is the film’s place on its release year’s domestic chart; a film outside that year’s top 50 shows a dash.
Film by film
0$250M$500M$750M
Midnight Express1978The Lord of the Rings1978Alien1979Heaven's Gate1980The Elephant Man198019841984Dead Man1995Rob Roy1995Contact1997Captain Corelli's Mandolin2001Dogville2004Hellboy2004The Skeleton Key2005Perfume: The Story of a Murderer2006V for Vendetta2006Indiana Jones and the Kingdom of the Crystal Skull2008Immortals2011Tinker Tailor Soldier Spy2011Only Lovers Left Alive2013Hercules2014Snowpiercer2014Jackie2016DomesticInternationalColumn height is worldwide · one film every 1.8 years
Profitability
Return on Budget
2.7x
$2.36B worldwide on $860.4M of production budget
Theatrical breakeven point is approx. 2.5x production budget
Domestic vs International Split
Domestic $917.5MInternational $1.44B
Return by film · worldwide ÷ budget
0x2.5x breakeven10.4x
Budgets are reported production costs and exclude marketing, so this is a gross-to-budget ratio rather than studio profit. Films with no reported budget, and streaming releases with no real theatrical run, are left out of this section entirely, including from the totals, rather than counted as zero.
Records held
All records →#4Biggest Memorial Day openingsIndiana Jones and the Kingdom of the Crystal Skull$126.9M#19Biggest May openingsIndiana Jones and the Kingdom of the Crystal Skull$100.1M
2 placings across 2 all-time charts. Where a film places on the same chart in consecutive weekends, only its best placing is shown.
What’s next
Full schedule →No upcoming movies announced yet.
Connected
Counted from this filmography. The number is how many of these films each one accounts for.