
Actor
Pierce BrosnanFollow
25 films•1992–2025•Thriller · Action · Adventure
Avg critics57%
Avg audience62%
Avg domestic$68.9M
Domestic
$1.585B
Lifetime
Worldwide
$4.105B
Lifetime
Avg opening
$16.9M
3-day
Filmography
| Film | Year | Opening | Domestic | Legs | Worldwide | CinemaScore | RT | Yearly rank |
|---|---|---|---|---|---|---|---|---|
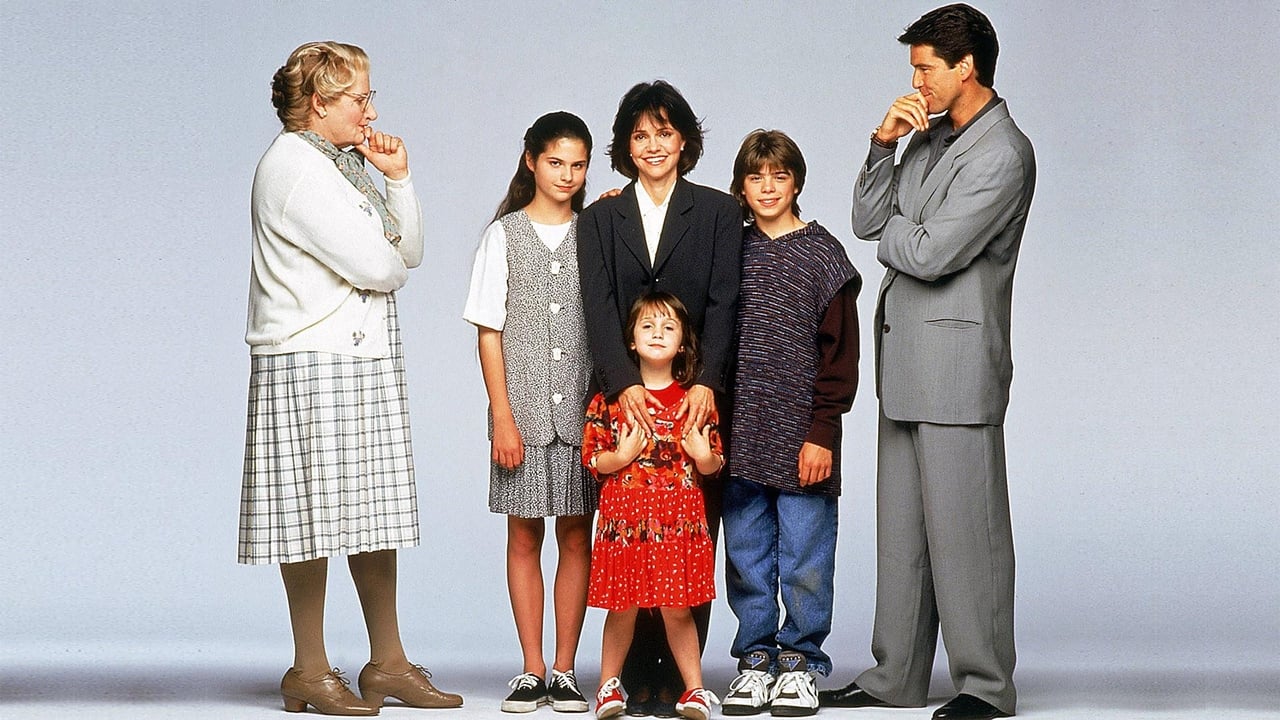
 Mrs. Doubtfire | 1993 | $20.5M | $219.2M | 10.7x | $441.3M | — | 71% | — |
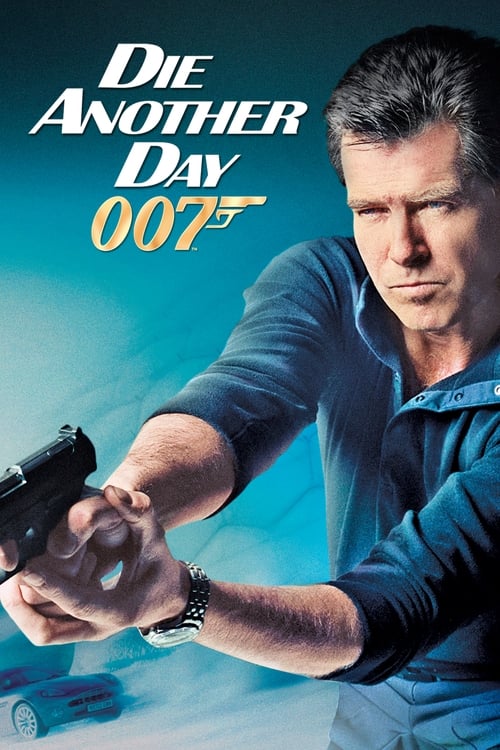 Die Another Day | 2002 | $47.1M | $160.9M | 3.42x | $431.9M | A- | 55% | #11 |
 Mamma Mia! | 2008 | $27.8M | $144.0M | 5.20x | $610.0M | A- | 55% | #13 |
 The World Is Not Enough | 1999 | $35.5M | $126.9M | 3.60x | $361.7M | — | 51% | — |
 Tomorrow Never Dies | 1997 | $25.1M | $125.3M | 5.00x | $339.5M | — | 58% | — |
 Mamma Mia! Here We Go Again | 2018 | $35.0M | $120.6M | 3.50x | $396.1M | A- | 80% | #28 |
 GoldenEye | 1995 | $26.2M | $106.4M | 3.84x | $356.4M | A- | 80% | — |
 Percy Jackson & the Olympians: The Lightning Thief | 2010 | $31.2M | $88.8M | 2.84x | $226.0M | B+ | 48% | #39 |
 The Thomas Crown Affair | 1999 | $14.6M | $69.3M | 4.70x | $124.3M | B+ | 68% | — |
 Dante's Peak | 1997 | $18.5M | $67.2M | 3.60x | $178.2M | A- | 34% | — |
 The King of Kings | 2025 | $19.4M | $60.3M | 3.10x | $83.4M | A+ | 61% | #37 |
 The Mirror Has Two Faces | 1996 | $12.2M | $41.3M | 3.40x | — | — | 51% | — |
 Mars Attacks! | 1996 | $9.4M | $37.8M | 4.00x | $101.4M | — | 56% | — |
 The Foreigner | 2017 | $13.1M | $34.4M | 2.60x | $145.4M | A- | 66% | — |
 The Lawnmower Man | 1992 | $7.8M | $32.1M | 4.10x | — | — | 35% | — |
 After the Sunset | 2004 | $11.1M | $28.3M | 2.60x | $38.3M | — | 18% | — |
 No Escape | 2015 | $8.1M | $27.3M | 3.40x | $42.8M | — | 46% | — |
 The November Man | 2014 | $7.9M | $25.0M | 3.20x | $34.8M | — | 36% | — |
 Black Bag | 2025 | $7.6M | $21.5M | 2.80x | $44.0M | B | 96% | — |
 Remember Me | 2010 | $8.1M | $19.1M | 2.40x | $56.5M | — | 26% | — |
 The Ghost Writer | 2010 | $183K | $15.5M | 7.50x | $65.5M | — | 84% | — |
 The Tailor of Panama | 2001 | $1.8M | $13.5M | 7.30x | $27.5M | — | 75% | — |
 The Thursday Murder Club | 2025 | — | — | — | — | — | 77% | — |
 Cinderella | 2021 | — | — | — | — | — | 41% | — |
 Eurovision Song Contest: The Story of Fire Saga | 2020 | — | — | — | — | — | 63% | — |
Click any column to sort. Yearly rank is the film’s place on its release year’s domestic chart; a film outside that year’s top 50 shows a dash.
Film by film
0$250M$500M
DomesticInternationalColumn height is worldwide · one film every 1.4 years
Profitability
Return on budget
3.4x
$4.105B worldwide on $1.203B of production budget
Theatrical breakeven point is approx. 2.5x production budget
Domestic vs international split
Domestic $1.511BInternational $2.594B
Return by film
Worldwide ÷ budget0x2.5x breakeven17.7x
Budgets are reported production costs and exclude marketing, so this is a gross-to-budget ratio rather than studio profit. Films with no reported budget, and streaming releases with no real theatrical run, are left out of this section entirely, including from the totals, rather than counted as zero.
Records held
All records#8Biggest 9th weekendsMrs. Doubtfire$8.8M#18Biggest March openingsCinderella$67.9M#18Biggest Labor Day openingsThe November Man$10.1M
Top 3 of 6 placings across 6 all-time charts. Where a film places on the same chart in consecutive weekends, only its best placing is shown.
What’s next
Full scheduleConnected
Series
Counted from this filmography. The number is how many of these films each one accounts for.